Overview
Learn about analytics
JWX Analytics provides the insights you need to make confident, data-driven decisions. Whether you're tracking top-line performance, optimizing viewer engagement, or integrating analytics into business systems, these analytics surface what’s working and where to focus next.
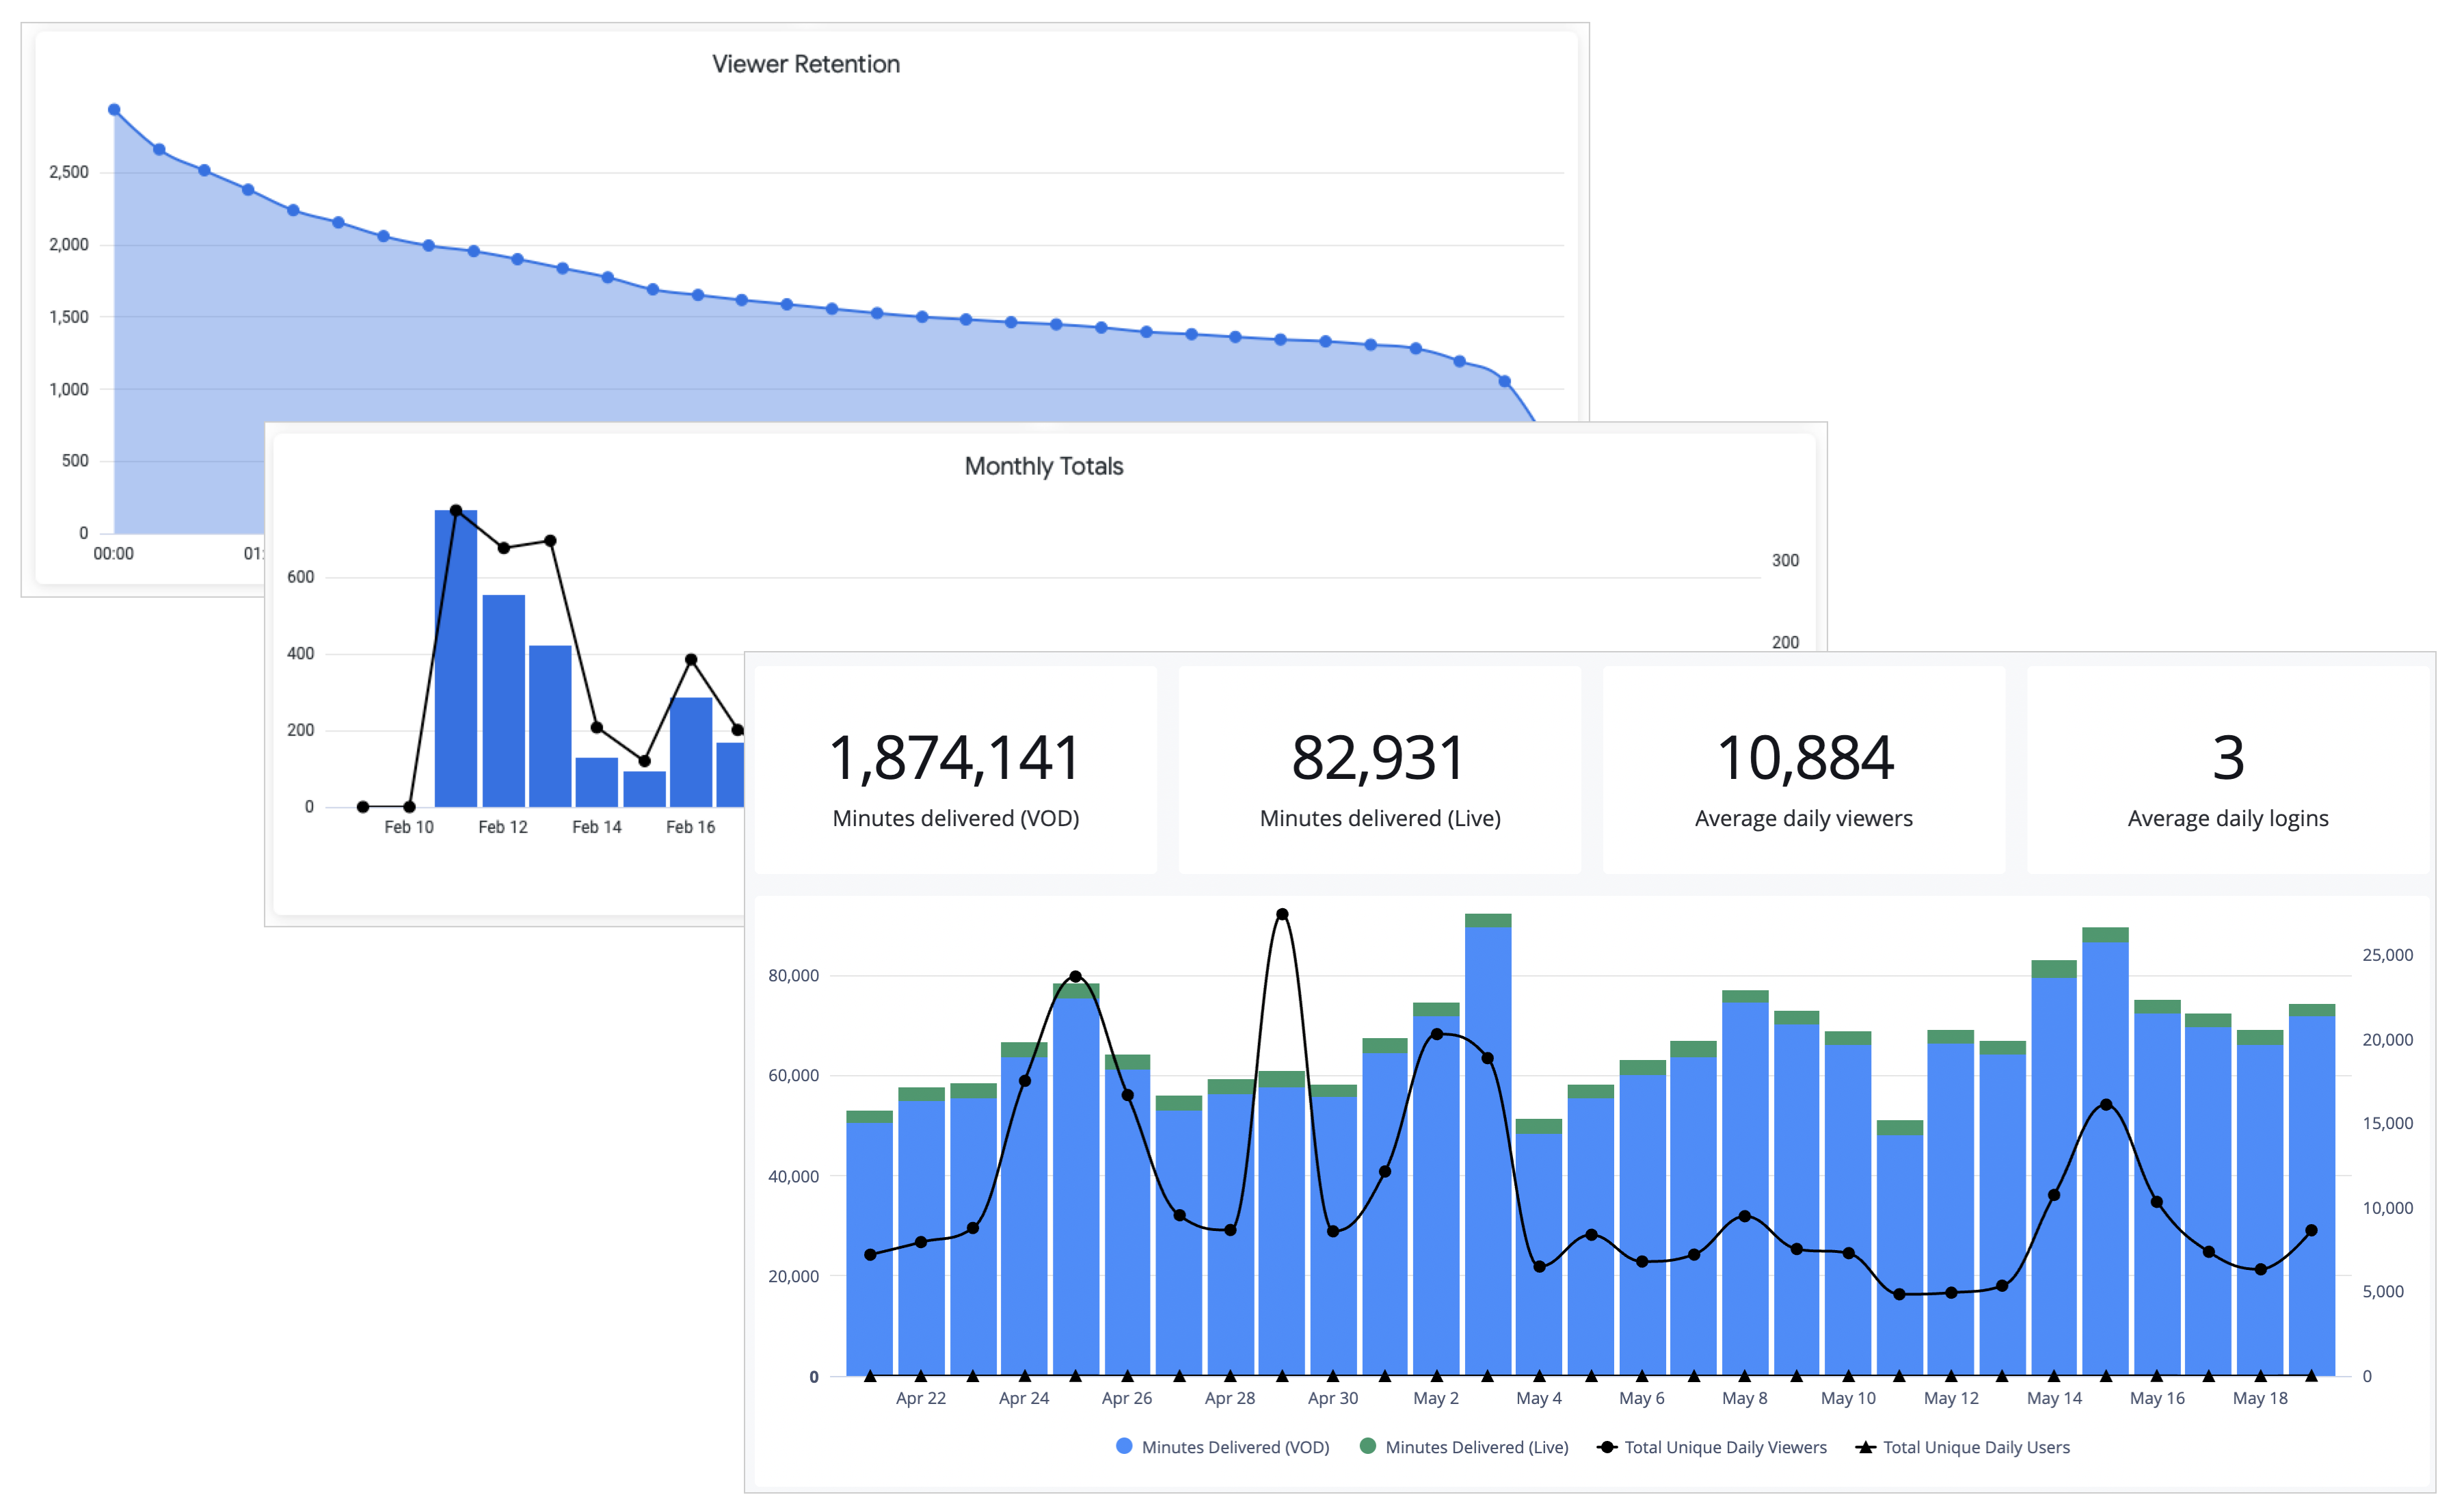
Analytics overview visualizations
These datasets capture how your video content and strategies perform across platforms and audiences. By tracking billions of events each month, JWX Analytics enable you to:
- Evaluate content and monetization effectiveness
- Test and optimize strategic rules and placements
- Make smarter, faster decisions backed by data
You can access analytics through several interfaces that align with the questions you want to answer.
| Interface | Description |
|---|---|
| Dashboards | Visual summaries of video and streaming activity Example questions:
|
| Custom Reports | Querying with metrics, filters, and visualizations selected for your specific needs Example questions:
|
| Data Sharing | Direct access to structured datasets via BigQuery or Snowflake Example questions:
|
| Dynamic Strategy Rule Analytics | Embedded performance data inside your strategy decision trees Example questions:
|
FAQ
What data is available?
Refer to the following reference for more information about the data made available through JWX Analytics:
Updated 8 months ago
What’s Next
Did this page help you?