Retrieve a HAR file
Generate and acquire a HAR file from an internet browser
An HTTP Archive (.har) file logs the interaction of a web browser with a website. The log contains a record of all the network requests made during a session and the corresponding responses, including request and response headers, cookies, and timings.
To assist with troubleshooting, the JWX Support team may ask you to provide a HAR log. This allows Support to see your browser's network requests, which may include information crucial to finding the root of an issue.
Retrieving a HAR file helps JWX Support do the following:
- Analyze the HTTP conversation to help diagnose errors and enhance loading times
- Diagnose and debug broken URLs, error codes, and other implementation errors
Generate a HAR file
You can generate a HAR file using a desktop or mobile device.
HAR logs may capture sensitive information such as passwords and keys. Before providing JWX Support with a HAR log, please remove any sensitive data. You can edit the file information in a text editor.
Desktop
On a desktop, you can use the developer tools in Google Chrome, Safari, or Firefox to generate and export a HAR file.
Google Chrome

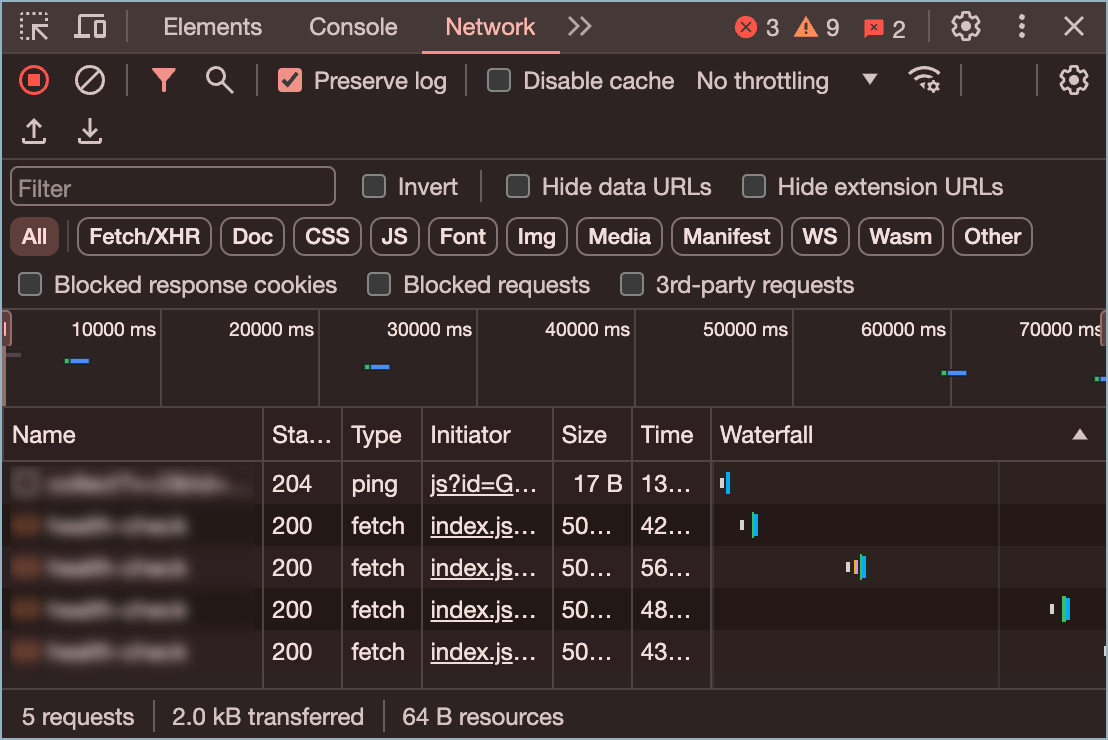
Network tab in DevTools panel
Follow these steps to generate a HAR file in Google Chrome:
- On the page where the issue is occurring, press ⌘ + ⌥ + I (Mac) or Ctrl + Shift + I (Windows). The Chome DevTools panel appears.
As an alternative, right-click the page and select Inspect.
- Click the Network tab. The network logs appear.
- Press ⌘ + Shift + R (Mac) or Ctrl + Shift + R (Windows) to refresh the page.
- Click Preserve log to maintain the log after the page reload.
- Click Clear network log (🚫) to clear all current network requests.
- Click Record network log (⏹).
If the button is red, the recording is in progress. If the button is black, the recording is stopped.
- On the page, reproduce the flow that is causing the issue.
Reproducing the flow will record the issue. JWX Support will be able to use this information to investigate the issue.
- In the DevTools panel, on the Network tab, right-click a log.
- Choose Save all as HAR with content. A popup window appears to save the HAR file.
- Click Save.
- Send the file to JWX Support.
Safari

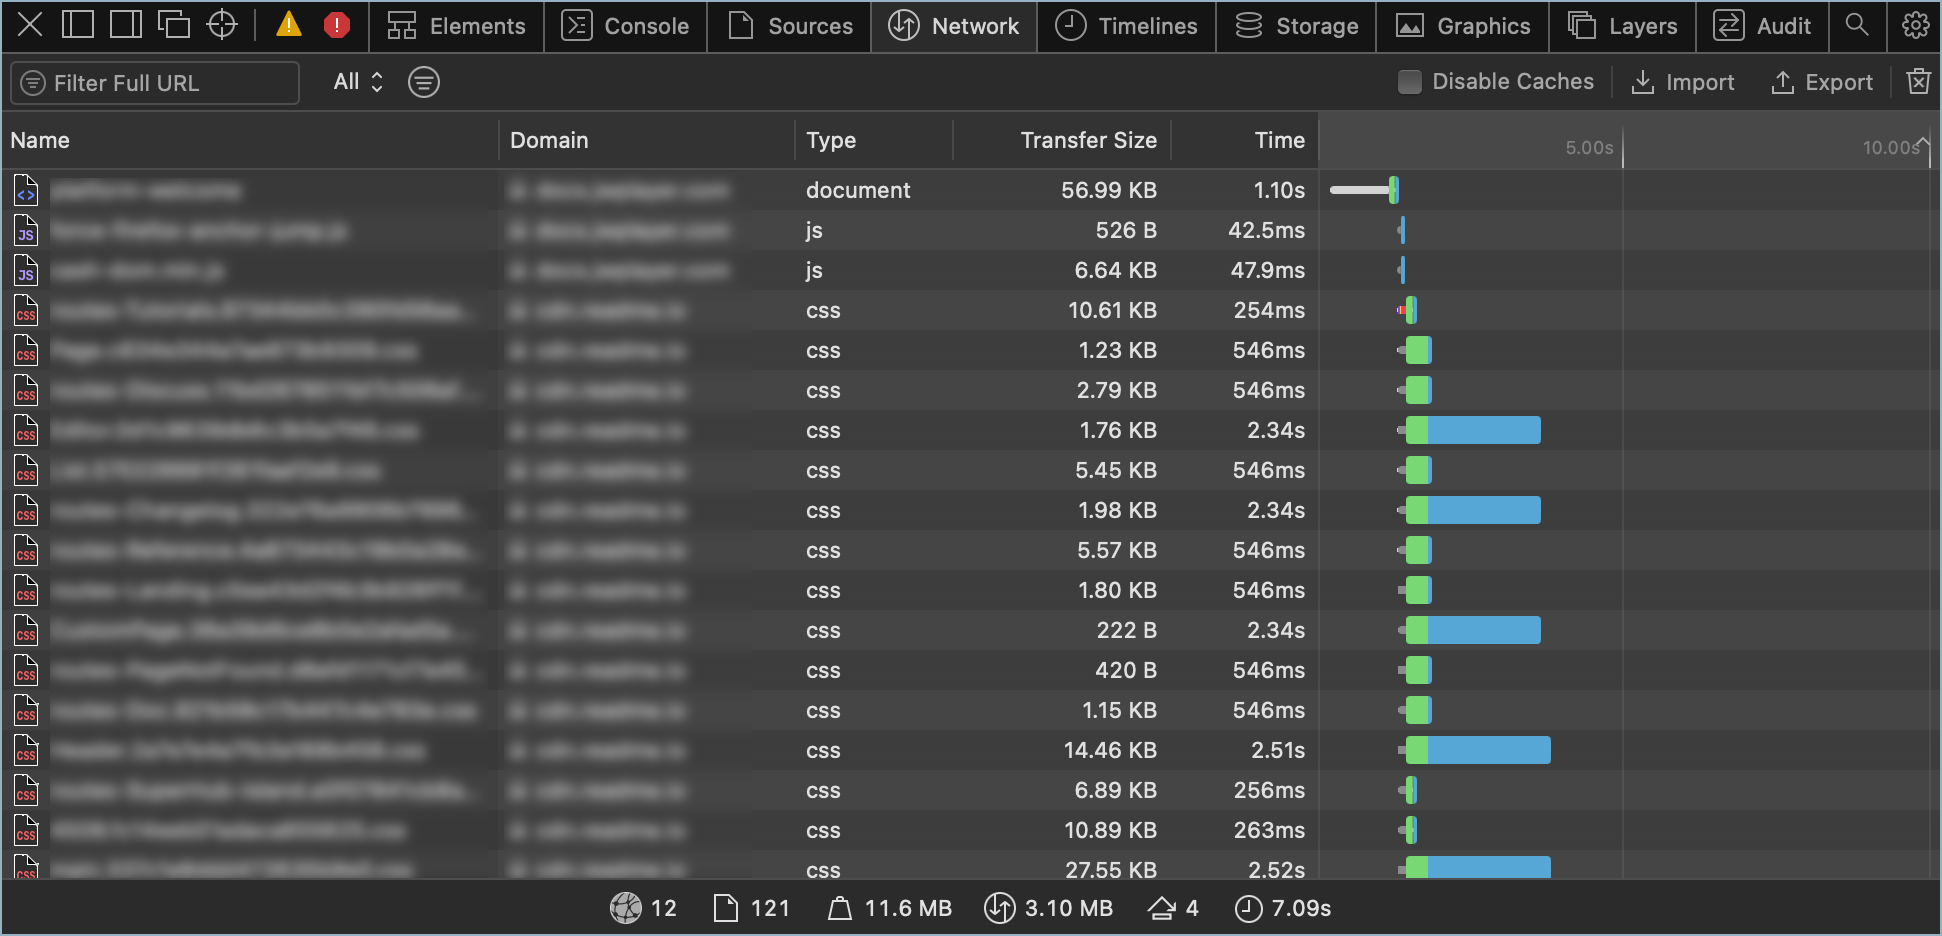
Network tab in Web Inspector panel
Follow these steps to generate a HAR file in Safari:
- On the page where the issue is occurring, press ⌘ + ⌥ + I. The Web Inspector panel appears.
If the Web inspector does not appear, you will need to enable Show features for web developers:
- Press ⌘ + ,. The Advanced tab appears in a popup window.
- Click Show features for web developers. Additional tabs will appear in the popup window. The Develop menu item will be added to the main browser window.
- Close the popup window.
- Click the Network tab. The network logs appear.
- Press ⌘ + ⌥ + R to refresh the page.
- On the page, reproduce the flow that is causing the issue.
Reproducing the flow will record the issue. JWX Support will be able to use this information to investigate the issue.
- Click Export. A popup window appears to save the HAR file.
- Click Save.
- Send the file to JWX Support.
Firefox

Network tab in Developer Tools panel
Follow these steps to generate a HAR file in Firefox:
- On the page where the issue is occurring, press ⌘ + ⌥ + I (Mac) or Ctrl + Shift + I (Windows). The Firefox Web Developer Tools panel appears.
As an alternative, right-click the page and select Inspect.
- Click the Network tab. The network logs appear.
- Press ⌘ + Shift + R (Mac) or Ctrl + Shift + R (Windows) to refresh the page.
- On the page, reproduce the flow that is causing the issue.
- In the Web Developer Tools panel, click ⛭ > Save All As HAR. A popup window appears to save the HAR file.
- Click Save.
- Send the file to JWX Support.
Mobile
On a mobile device, you can use the developer tools in Google Chrome (Android) or Safari (iOS) to generate and export a HAR file.
Google Chrome (Android)
Follow these steps to generate a HAR file in Google Chrome:
- On your Android device, enable developer options.
- Enable USB debugging.
- On your desktop, open Chrome and navigate to
chrome://inspect#devices. The DevTools portal appears. - (If applicable) Click Discover USB Devices to enable connection to the mobile device.
- Using a USB cable, connect your Android device to your desktop.
If an Allow USB debugging prompt appears, click Allow.
- On your Android device, navigate to the Chrome page where the issue occurs.
- On your desktop, in the DevTools portal, locate your mobile device in the Devices list.
- Click Inspect beside the tab where the issue occurs. The DevTools panel appears.
- Click the Network tab. The network logs appear.
- Press ⌘ + Shift + R (Mac) or Ctrl + Shift + R (Windows) to refresh the page.
- On the page, reproduce the flow that is causing the issue.
Reproducing the flow will record the issue. JWX Support will be able to use this information to investigate the issue.
- Once the issue has been reproduced, click Export to save the HAR file.
- Send the file to JWX Support.
Safari (iOS)
These steps require a Mac. If you do not have access to a macOS desktop, you may use third-party tools, such as Inspect or BrowserStack.
Follow these steps to generate a HAR log in Safari:
- On your iOS device, click Safari > Settings > Advanced. The Advanced settings appear.
- Toggle Web Inspector to ON.
- On your Mac, click Safari > Settings > Advanced. The Advanced settings appear.
- Click the Show features for web developers check box.
- Using a USB cable, connect your iOS device to your Mac.
- On your iOS device, navigate to the Safari page where the issue occurs.
- On your Mac, click the Develop tab of the top menu. A list of connected devices appears.
- Select your iOS device. A slide menu appears with the device’s Safari browsing URL.
- Select the URL tab where the issue occurs. The Web Inspector module opens.
- Click the Network tab. The network logs appear.
- Press ⌘ + Shift + R to refresh the page.
- On the page, reproduce the flow that is causing the issue.
Reproducing the flow will record the issue. JWX Support will be able to use this information to investigate the issue.
- After reproducing the issue, click Export to save the HAR file.
- Send the file to JWX Support.
Send a HAR file to JWX Support
After generating a HAR file, you can send the file to JWX Support through the Help Center, email, or cloud sharing.
Help Center
If you are communicating with JWX Support through the Help Center, follow these steps to attach the HAR file to your response:
- Log in to the JWX Help Center.
- Navigate to the relevant ticket.
- In the ticket conversation, click Add file to attach the HAR file. A file selector appears.
- Select the HAR file for upload. The file appears in the conversation string.
If an error callout appears due to upload failure, send the HAR file through cloud sharing.
- (Optional) Enter a message to accompany the HAR file.
- Click Submit.
Email
If you are communicating with JWX Support through email, send the HAR file as an attachment in the email thread.
If the file is too large to be sent via email, send it through cloud sharing.
Cloud Sharing
If your HAR file is too large to be sent through the Help Center or email, you can send the file using a cloud storage provider such as Google Drive or WeTransfer.
If you do not have access to cloud services, contact JWX Support to request a folder to upload the HAR file.
Updated 5 months ago
