Track strategy performance
View traffic flow across decision branches
Dynamic Strategy Rules help optimize video engagement and ad performance. Understanding how a specific strategy performs across different decision points can be difficult, especially without access to dedicated data analysts.
Dashboard analytics for Dynamic Strategy Rules provide high-level performance data within the strategy’s decision tree:
- Track traffic flow percentages, with absolute embed counts visible on hover, across rule branches
- Compare performance across strategy versions
- Respond to usage patterns and improve strategies over time
Dashboard analytics
These analytics reveal how traffic flows through each version of a rule and identify which branches perform more effectively.
To review more detailed, robust data, set up Data Sharing and analyze the Dynamic Strategy Rules Dataset.
View dashboard analytics
Follow these steps to view the analytics of a strategy:
-
On the Dynamic strategy rules page, on the Strategies tab, hover over a strategy row and click
 (Analytics & History icon). The decision tree of the strategy appears.
If you are already viewing a specific decision tree, click Analytics & History at the top of the page.
-
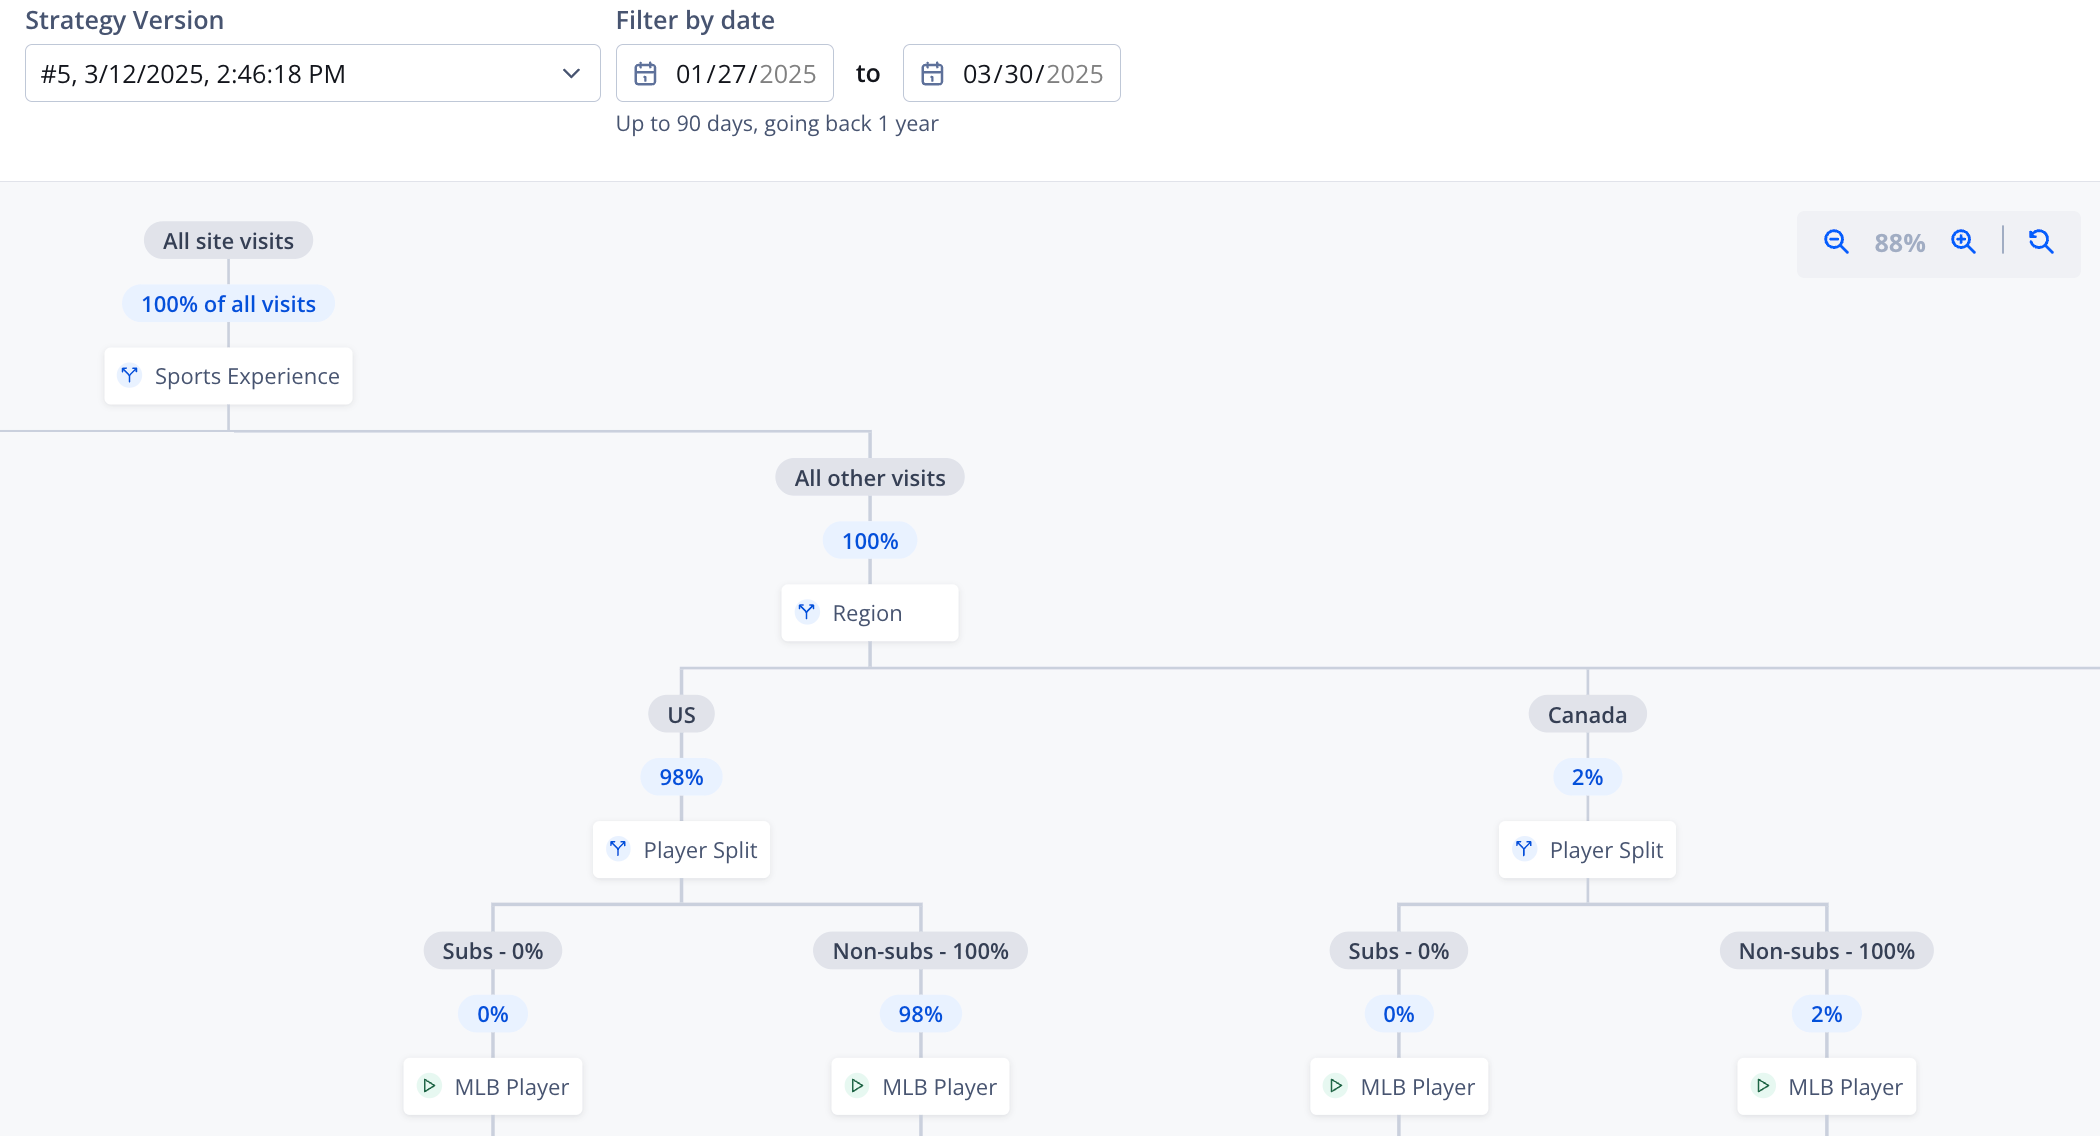
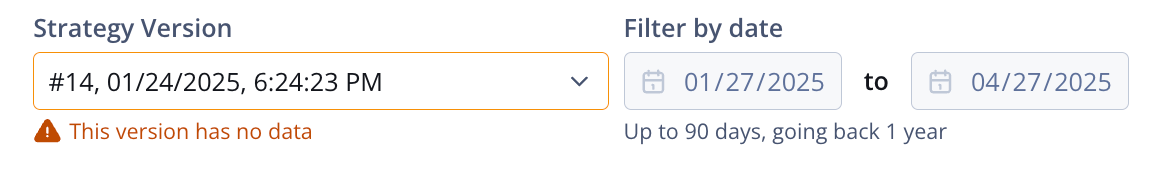
From the Strategy Version dropdown menu, select a date.
A new version is created each time the strategy is updated. If a version does not contain data, a message appears.
-
(Optional) Use the Filter by date fields to narrow the data scope. Updated traffic percentages will appear along each corresponding branch in the decision tree.
The selected range must not exceed 90 days and cannot begin earlier than one year from the current date.
-
(Optional) View node-specific data.
View node-specific data
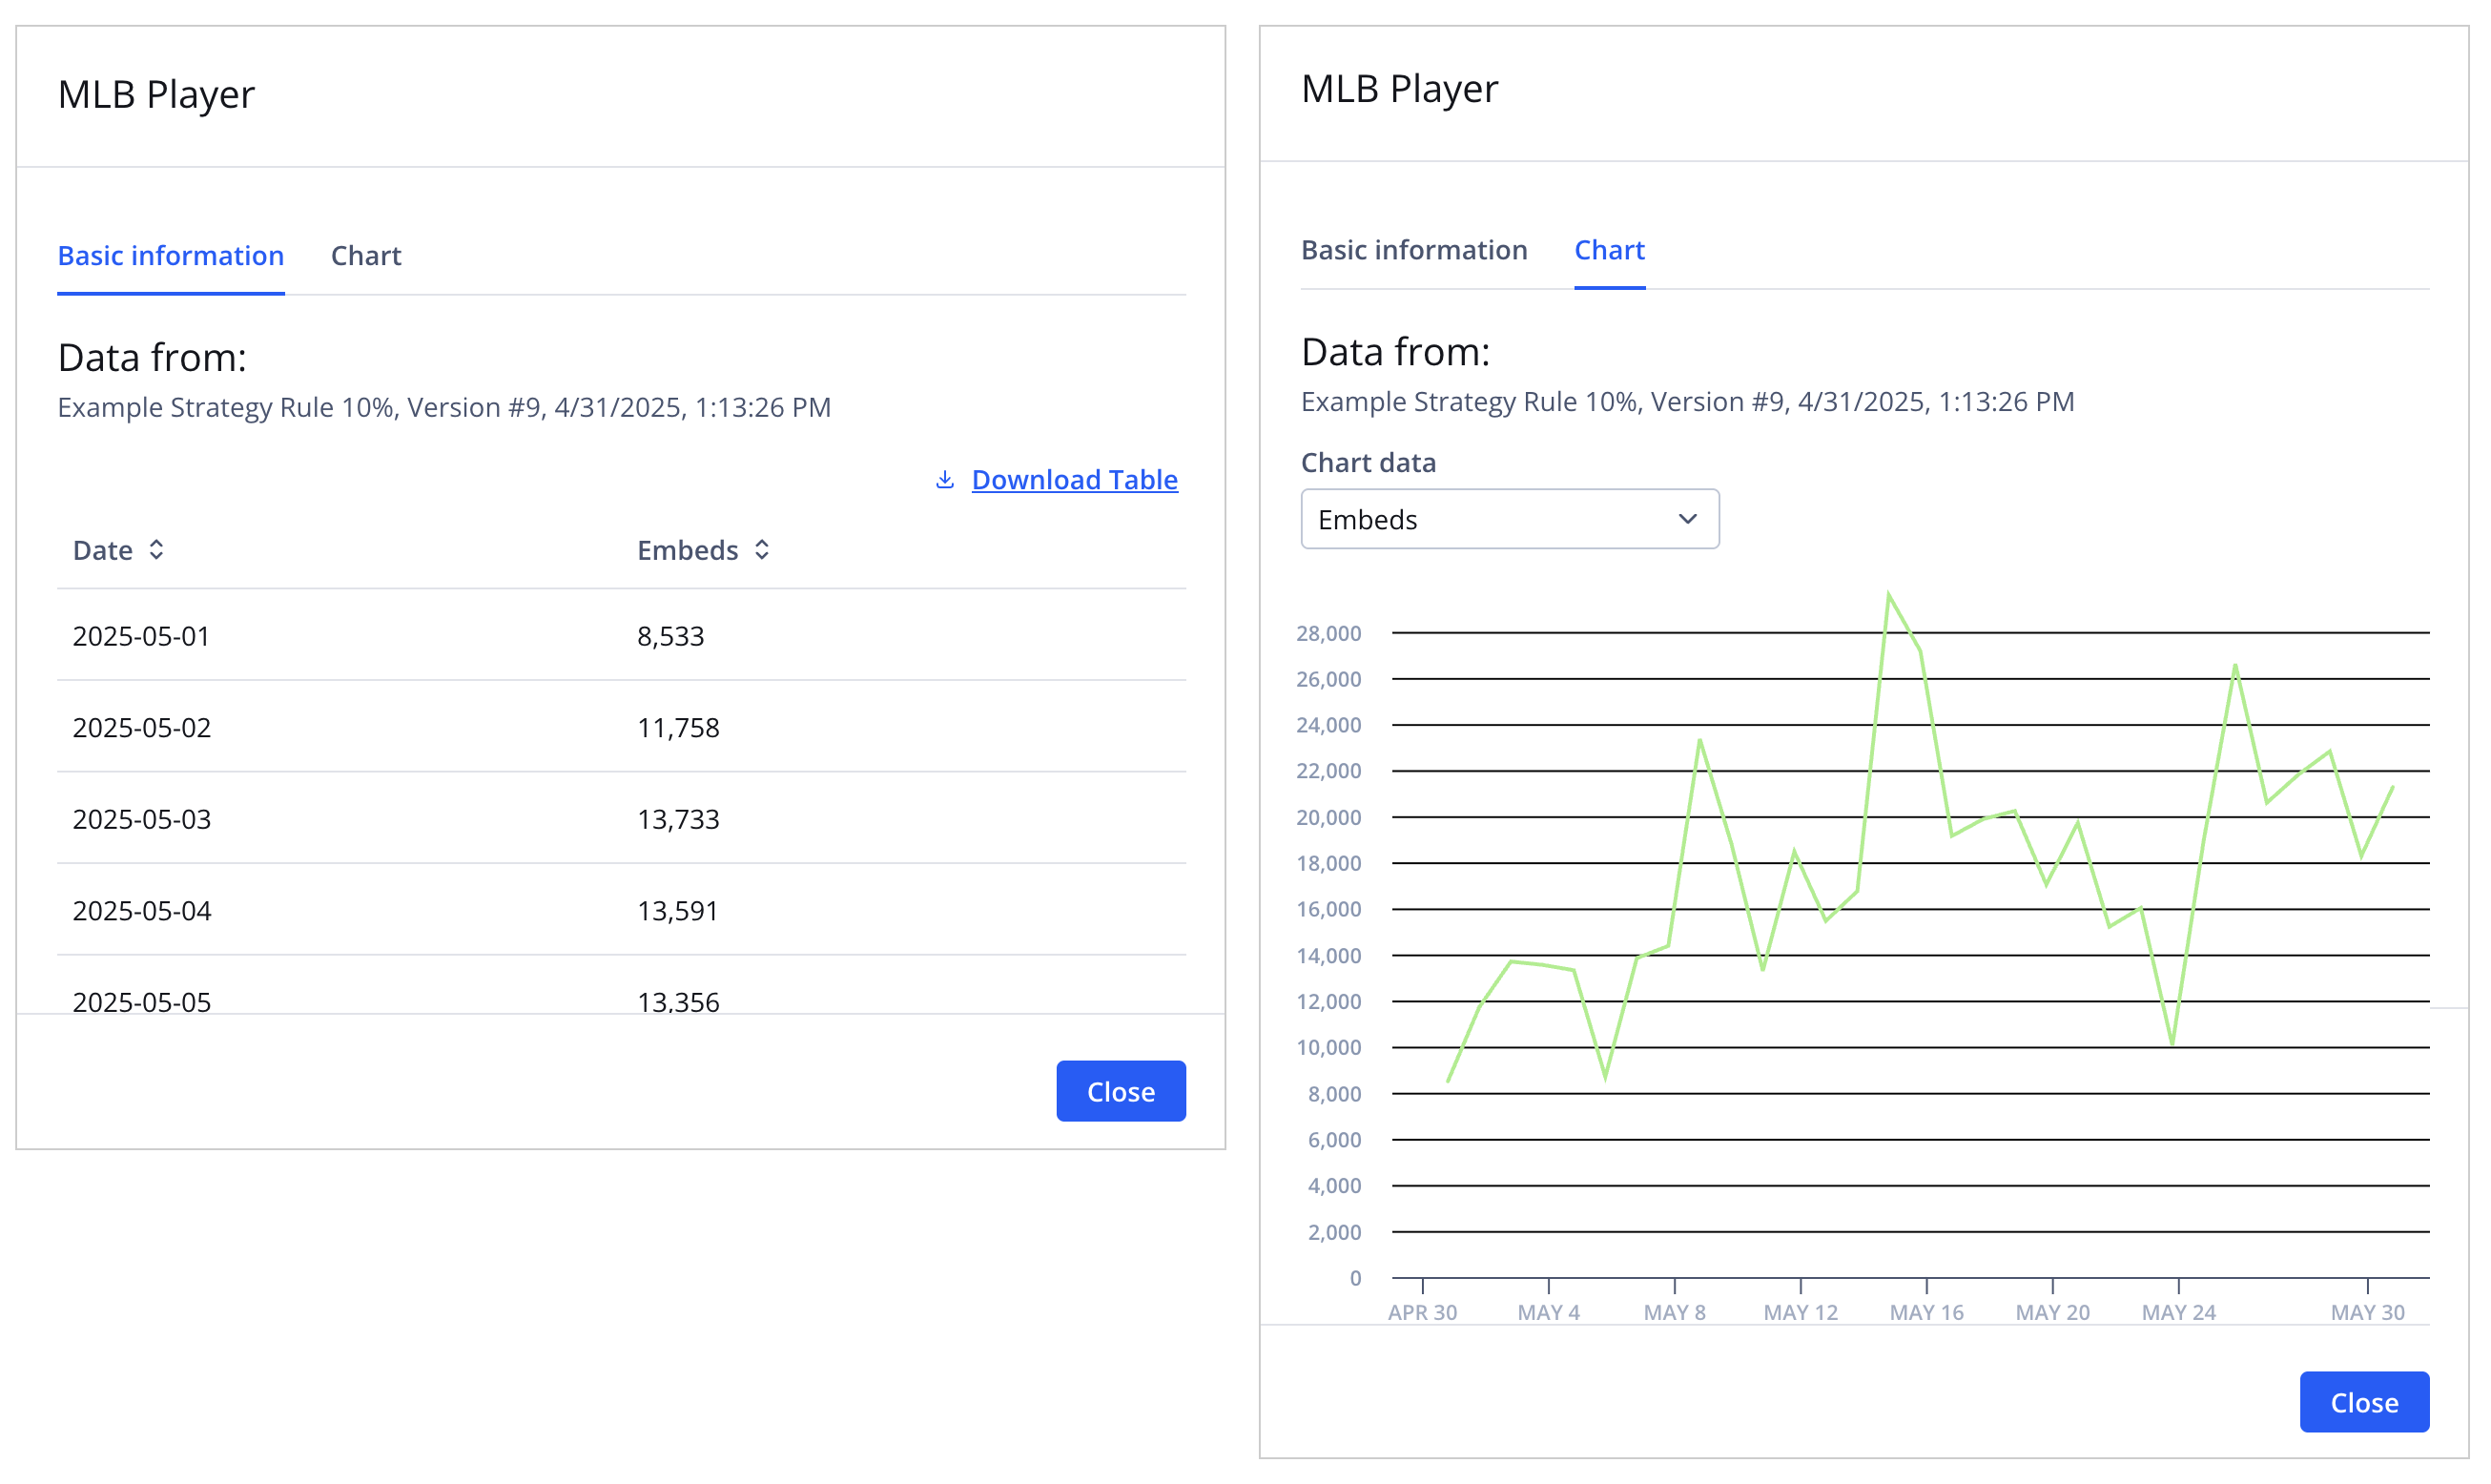
Within a specific strategy version, you can view node-specific data in tabular or visual format to understand how traffic flows through that node.
Node-specific data panels
The following table shows how to access node-specific data in both formats.
| Format (UI tab) | Details |
|---|---|
| Tabular (Basic information tab) | Node-specific data displayed in tabular format and available for download as a .csv file Follow these steps to view node-specific data:
|
| Visual (Chart tab) | Node-specific data displayed in a visual format Follow these steps to view node-specific data:
|
Updated about 1 year ago