
Real Time

Real time analytics is only relevant to plays with a media ID and using a JWX data source.
For Apps analytics, read the How do I create a Custom report to assess the performance of my Apps? FAQ.
Real time analytics shows you key data points over a two-minute window to help you monitor the current viewership of your content:
- Number of active viewers watching your content
- Locations and domains of your viewers
- Devices from which your content is viewed
- Top content being actively viewed
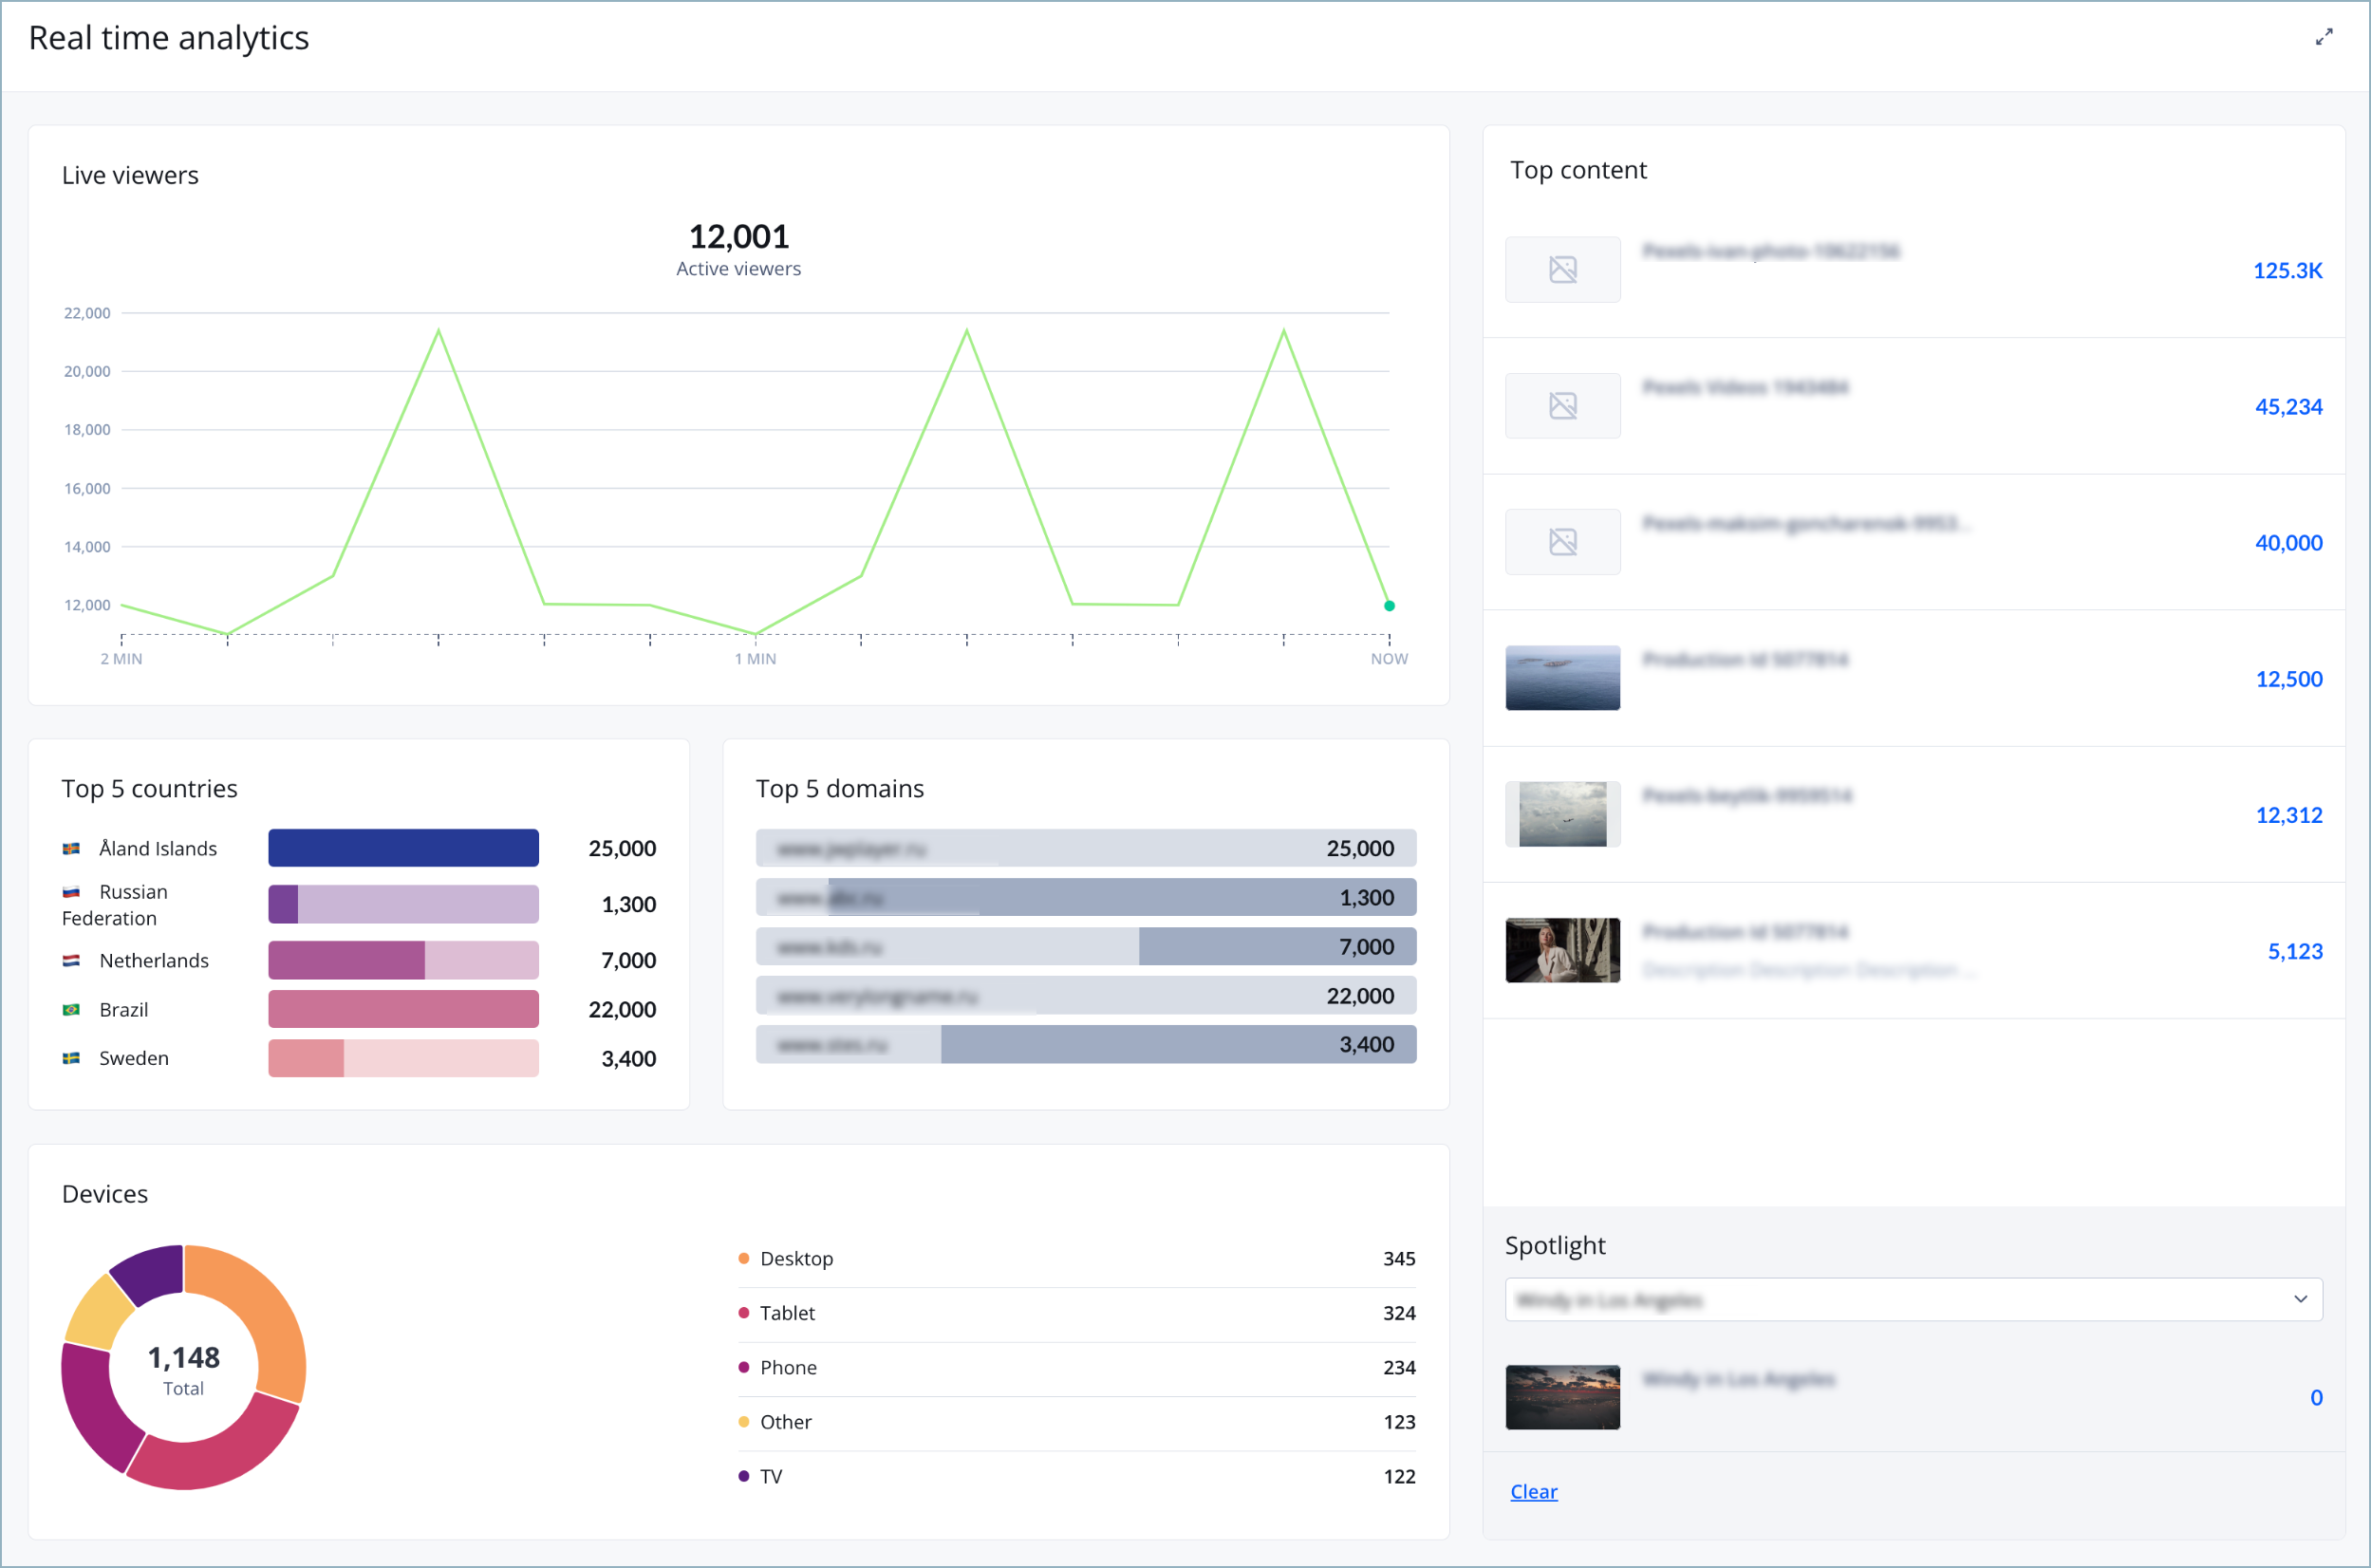
Real time analytics dashboard
The Real time analytics dashboard is a snapshot in time that provides you with a general idea of current viewership of your content. The accuracy of the user counts will vary depending on various factors, including the following:
- Viewer’s connection
- Frequency with which a device is pinging back to JWX during video playback
To perform accurate investigation and analysis over time, use the Analytics page or Custom reports.
Monitoring
Monitor all real-time analytics
- From the side navigation, click Real time.
Monitor a single media item
- On the Real time analytics page in the Spotlight panel, click in the Search bar.
- Type to search for a media or select from the auto-suggest options in the list.
Panels
The following table explains each of the six panels of the Real time analytics dashboard.
| Panel | Description |
|---|---|
| Live Viewers | Total number of active viewers watching your content
You can hover over the line graph to see the number of active viewers at different times during the previous two minutes. |
| Top 5 Countries | Top five countries from which viewers are watching your content |
| Top Domains | Top several domains from which viewers are watching your content |
| Devices | Devices on which viewer are watching your content |
| Top Content | Top six videos watched by viewers
|
| Spotlight | Total number of viewers for the content that you have selected |
Updated 29 days ago