Streaming
Learn how to interpret and refine streaming performance data
Understanding the scope and patterns of your streamed content enables you to optimize your content strategy. While you may be delivering high volumes of streamed minutes, actual consumption may fall short of business goals:
- High daily views may not lead to high subscriber conversion
- Viewing may be concentrated in low-priority regions
- Streaming minutes may be declining over time
To identify and address these issues, you need meaningful insight.
The Streaming tab offers a high-level view of how audiences interact with your streamed content. This includes daily viewing and login trends, time-based usage patterns, and geographic and platform-specific insights.
Steaming tab
Use the Streaming tab to answer key questions such as:
- How large is the daily audience across Live and VOD content?
- Are logged-in subscribers actively watching content?
- Which countries, devices, or titles are driving the most streaming minutes?
- Is viewership shifting over time, and where are those changes occurring?
Explore the Streaming tab
Each section of the Streaming tab highlights a specific part of the streaming content experience. The following table explains each section and potential business usage.
| Section | Description | Business Use |
|---|---|---|
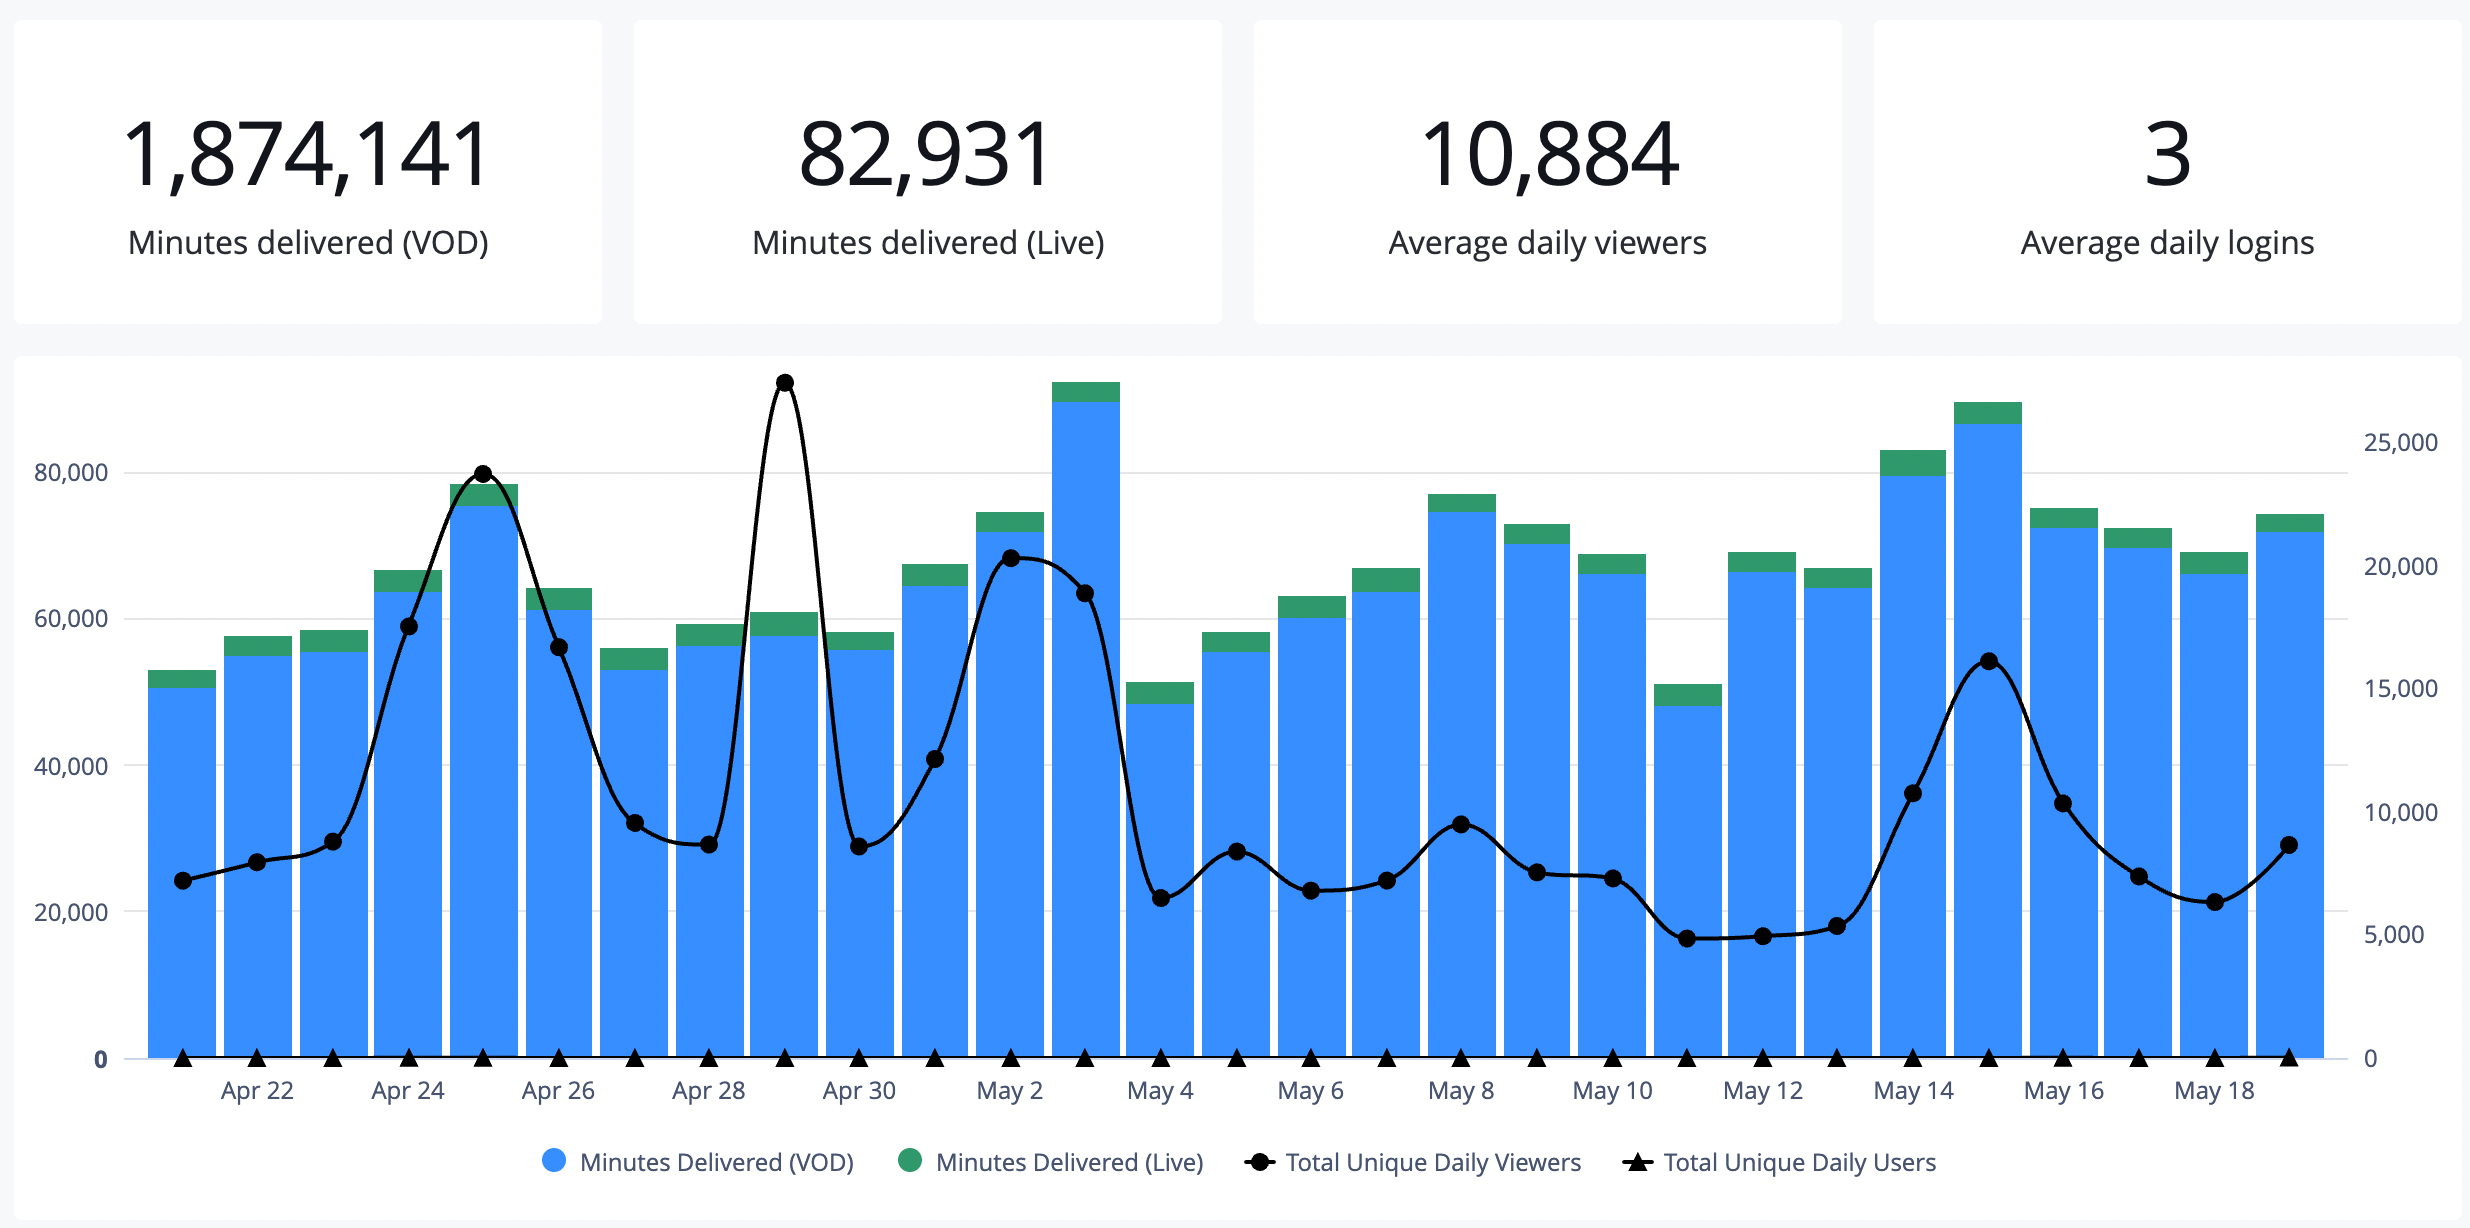
| Minutes delivered (VOD) | Number of minutes of VOD content streamed | View usage during a specific timeframe. |
| Minutes delivered (Live) | Number of minutes of Live content streamed | View usage during a specific timeframe. |
| Average daily viewers | Average number of daily viewers watching streamed content | Understand the size of your audience across Live and VOD streamed content. |
| Average daily logins | Average number of logged in subscribers watching streamed content | Learn the size of your logged in subscriber audience across Live and VOD streaming. |
| Visualization | Time-based chart comparing minutes of content streamed (bars) and viewers (line) | Identify shifts in streamed (Live or VOD) minutes or audience size (non-subscribers or subscribers). |
| Top countries | Countries ranked by total (Live and VOD) minutes and daily viewers | Identify where your most active active viewers are located. |
| Top platforms | Viewer platforms ranked by total (Live and VOD) minutes streamed and daily viewers | Understand which devices drive the most content consumption. |
| Top media | Videos ranked by Live minutes, VOD minutes, daily viewers, and total users | Identify your most popular content. |
Refine the data
By default, the dashboard displays results from the Last 30 days across all Live and VOD streamed content. You can adjust the dataset by selecting an alternate predefined timeframe or isolating a specific media title.
Follow these steps to update the displayed data:
- On the Analytics overview page, on the Streaming tab, select a predefined Timeframe (UTC).
- (Optional) From the Analytics per media dropdown menu, select or type the name of a single media to analyze.
- Click Run report. The dashboard data will update.
Updated 7 months ago