
Ad insertion
Learn how to analyze and optimize server-side ad performance for your streamed content
The Ad insertion tab helps you understand how server-side ads perform across your streaming content. These insights help you assess monetization health, identify demand or delivery issues, and refine your SSAI strategy for stronger revenue outcomes.
You can use JWX’s SSAI analytics to answer critical questions about your advertising:
- Demand: Are your ad servers returning enough ads to meet your inventory opportunities?
- Delivery: Are the returned ads being stitched and played back successfully?
- Experience: How many ads does a typical viewer receive during playback?
The Ad insertion tab provides the data you need to evaluate the strength of your ad stack, troubleshoot mismatches between ad calls and impressions, or optimize ads per session.
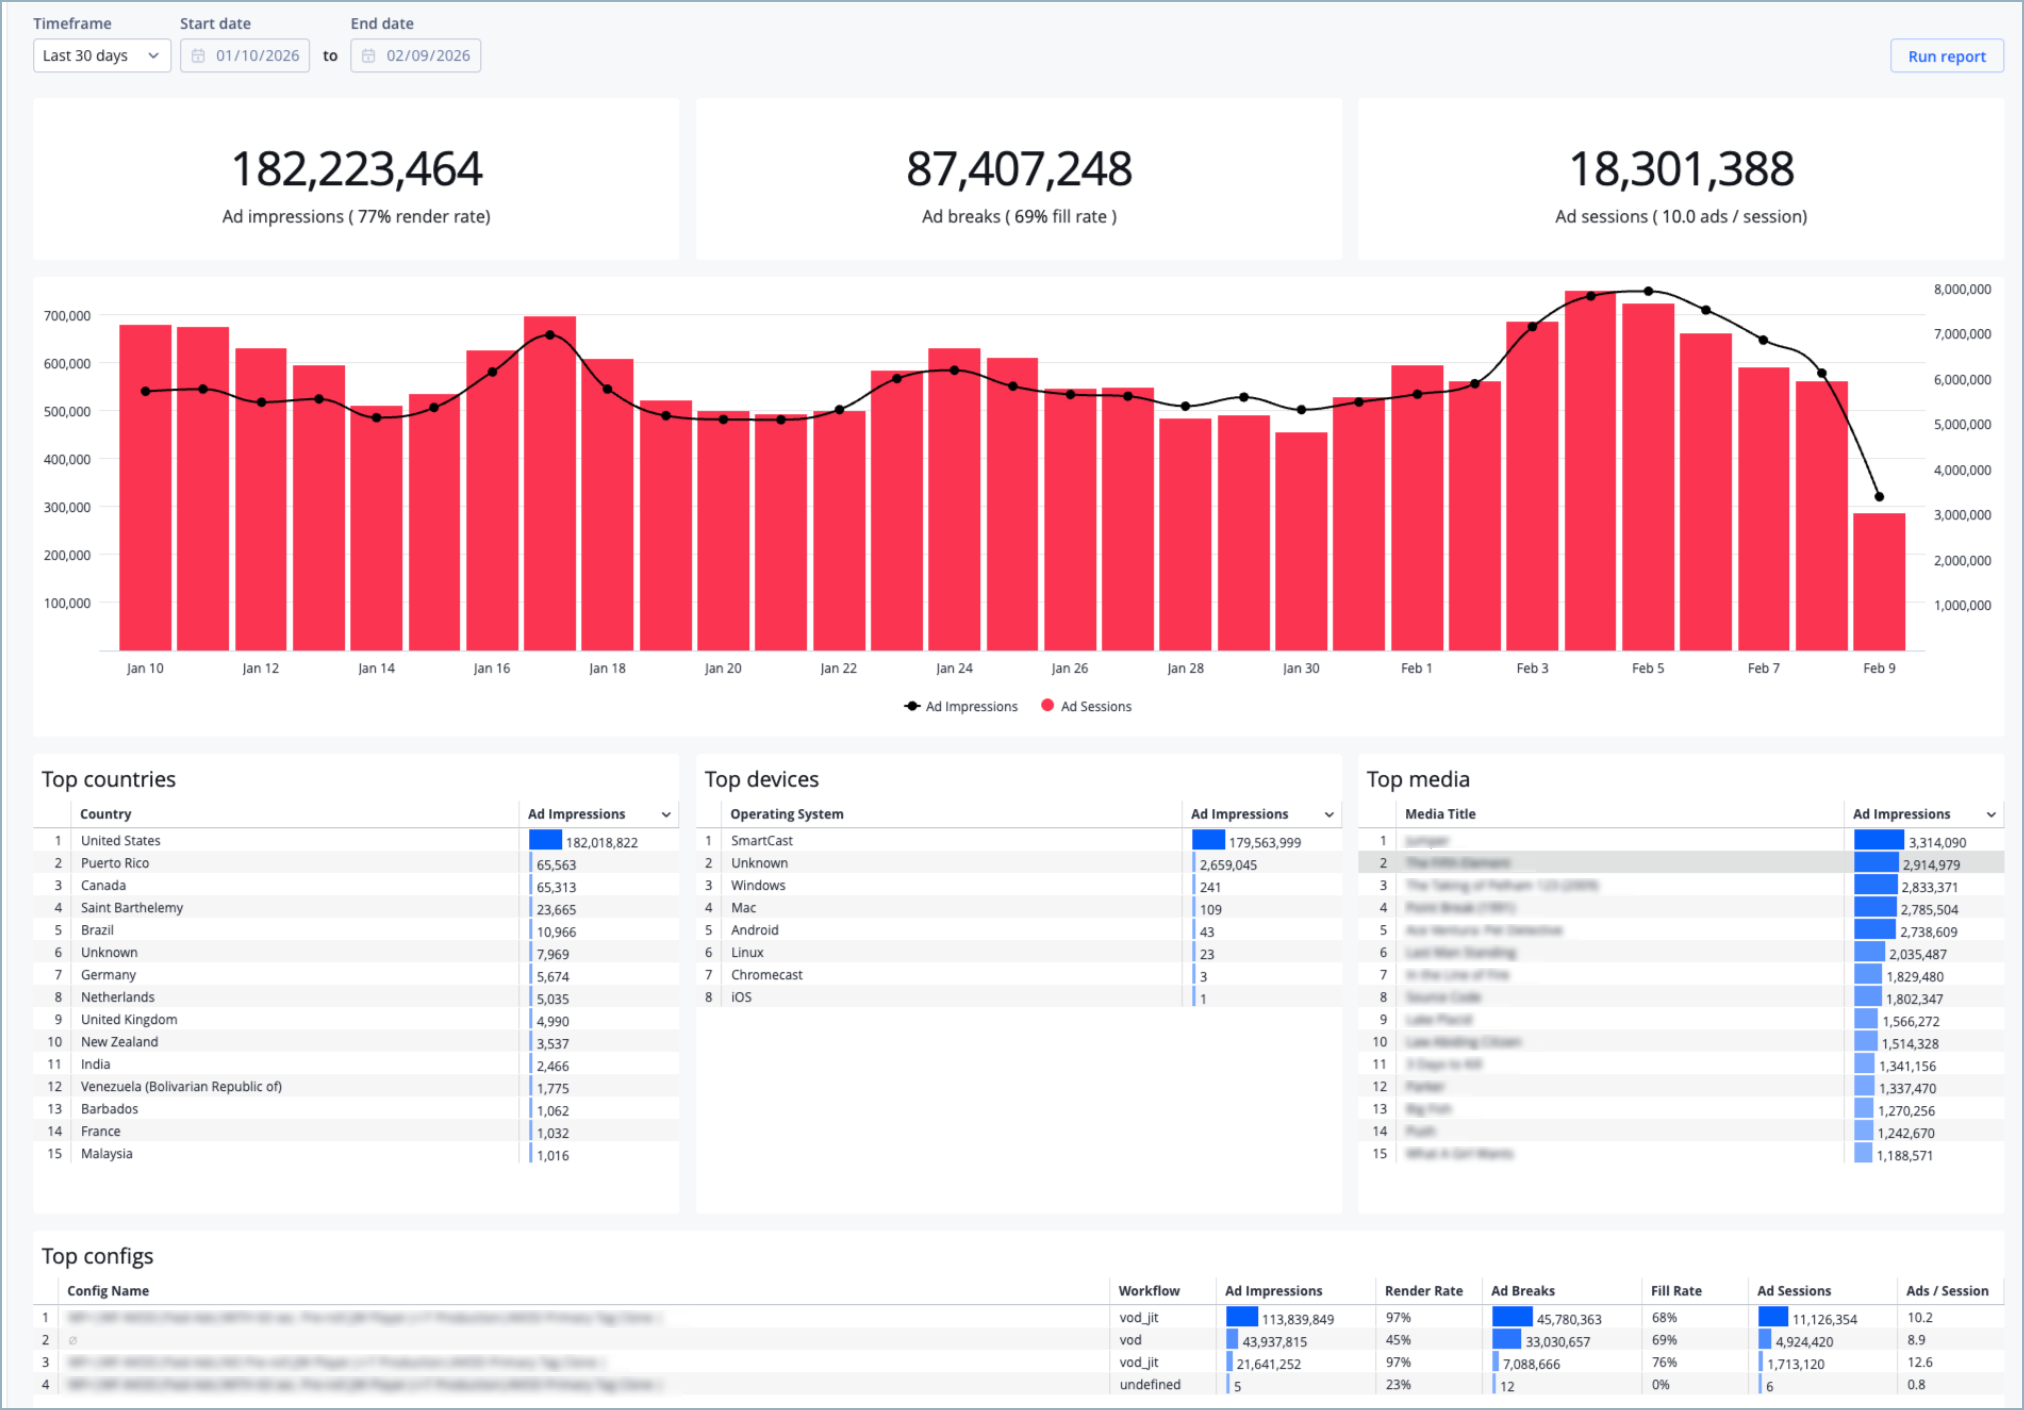
Ad insertion tab
Explore the Ad insertion tab
The Ad insertion tab displays key SSAI metrics that show how your ads perform. The following table explains these metrics and their uses.
| Metric | Definition | Use Case |
|---|---|---|
| Ad impressions | Number of ads successfully delivered to viewers | Measure delivery success and overall monetization output. A sudden drop may signal stitching or creative issues. |
| Render rate | Number of ad impressions divided by the number of ads returned by the ad server | Evaluate your delivery. Low render may indicate stitching failures or invalid creatives. |
| Ad breaks | Number of ad breaks where ads were inserted into the stream | Validate that expected breaks (scheduled or dynamic) are being generated. Compare against impressions to identify fill gaps. |
| Fill rate | Number of ads returned by the ad server divided by the number of ads requested by the SSAI system | Evaluate your demand. Low fill may indicate weak campaigns, misconfigured targeting, or insufficient inventory. |
| Ad sessions | Number of video plays that included at least one ad break | Measure how many viewer playbacks generate monetizable opportunities. |
| Ads per session | Average number of ads served per video play | Evaluate the viewer experience and overall revenue efficiency for each session. High values may indicate strong monetization, while low values indicate missed opportunities. |
| Top countries | Countries ranked by total ad impressions | Identify where ads are being delivered geographically. |
| Top devices | Device types ranked by total ad impressions | Evaluate how ad delivery performs across devices. Differences may indicate device-specific demand, playback compatibility, or delivery limitations. |
| Top media | Videos ranked by total ad impressions | Identify which content drives the most ad impressions. |
| Top configs | Ad configs ranked by total ad impressions | Compare performance across JWX ad configs to evaluate different ad experiences. Use configs to support A/B testing, audience segmentation, and traffic splits defined through SSAI strategies. This view also helps you assess performance by workflow, such as how ads are stitched (JIT or non-JIT), to identify setups that deliver higher fill, render rates, and overall monetization efficiency. |
Refine the data
By default, the dashboard displays your server-side advertising results for the last 30 days. However, you can adjust the dataset by selecting an alternate predefined timeframe.
Follow these steps to alter the displayed data:
-
On the Analytics overview page, on the Ad insertion tab, click UTC Date. A dropdown menu appears.
-
Select a date range from the dropdown.
Option Description Predefined Follow this step to select a preset date range: - From the Timeframe dropdown menu, select a predefined period.
Custom Follow these steps to select a custom date range: - From the Timeframe dropdown menu, click Custom.
- Select the Start date.
- Select the End date.
The custom date range must be within the last 18 months and no longer than 90 days. -
Click Run report. The dashboard data will update.
Updated about 1 month ago