Playback
Learn how to interpret and refine video performance data
A video may attract strong viewership and still fail to achieve business objectives:
- Ad impressions may be low
- High-performing content may be concentrated in low-monetization regions
- Highly engaging videos are overlooked while lower-impact content receives priority exposure
To identify and address these issues, teams need meaningful insights.
The Playback tab provides a comprehensive view of video performance across plays, ad impressions, geography, platform, and viewer engagement. The timeframe can be adjusted to analyze trends spanning multiple years. Insights from this tab equip teams to identify high-performing content, address underperformance, and plan future content more effectively.
Playback tab
Use the Playback tab to answer key questions such as the following:
- Which videos generate the most meaningful engagement?
- Are ad views aligned with content consumption?
- Where in the playback journey are we losing viewers?
Explore the Playback tab
Each section of the Playback tab highlights a specific part of the video experience. The following table explains each section and potential business usage.
| Section | Description | Business Use |
|---|---|---|
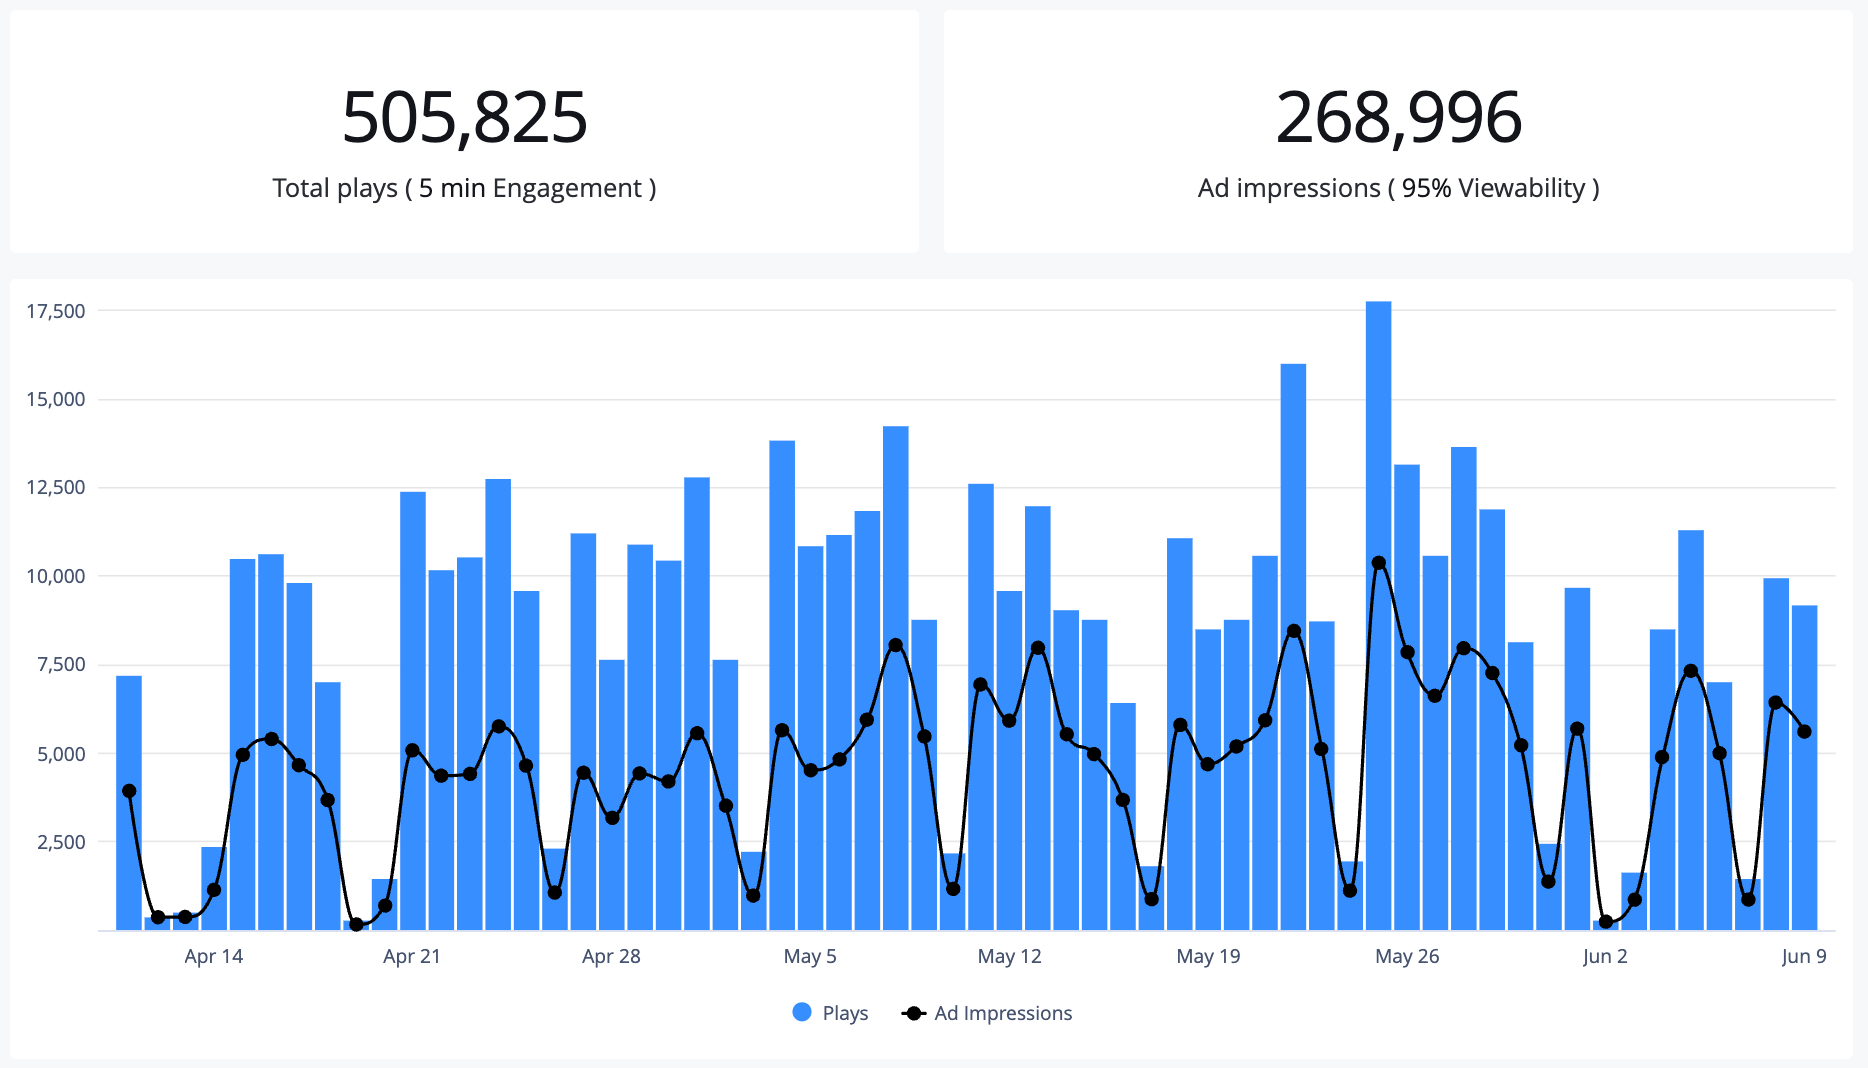
| Total plays | Number of video plays | View usage or general site / media popularity during a specific timeframe. |
| Ad impressions | Number of ads that began playing across embedded video players | Track how many ads are actually delivered to viewers. |
| Daily totals | Time-based chart comparing content plays (bars) and ad impressions (line) | Identify shifts in viewer activity or ad delivery performance. |
| Top media | Videos ranked by video plays, engagement duration, ad impressions, and viewability rate | Identify your highest-traction content and how effectively it retains viewers. |
| Top platforms | Viewer platforms ranked by video plays and ad impressions | Understand which devices drive the most views and ad inventory. |
| Top domains | Domains where video content is played, ranked by the number of video plays | Identify which partner sites or properties drive the most video engagement, helping to inform distribution strategies and content placement decisions. |
| Top countries | Countries ranked by total video plays and ad impressions | Identify where your most active and monetizable audiences are located. |
| Video assets breakdown | Media types in the account’s video library, along with how many have received plays (Active Videos) within the selected time period | Monitor asset usage to identify underperforming or inactive media types, supporting efficient library cleanup and better content lifecycle management. |
Refine the data
By default, the dashboard displays results from the Last 30 days across all media. You can adjust the dataset by selecting an alternate predefined timeframe or isolating a specific media item.
Follow these steps to update the displayed data:
-
Navigate to the Analytics overview page from one of the following locations:
Main navigation
From the side navigation, under ANALYTICS, click Overview. The Analytics overview page appears displaying results across all media.Media library page
- On the Media library page, hover over the row of a media item.
- Click
 (the View analytics icon). The Analytics overview page appears displaying only results for the specific media item.
Media item details page
- On the Media library page, click the name of a media item. The media item's details page appears.
- Click View analytics. The Analytics overview page appears displaying only results for the specific media item.
-
On the Playback tab, select a predefined Timeframe (ET).
Playback metrics are based on US - Eastern (UTC -4 / UTC -5). The reporting time is affected by whether daylight saving time or standard time is in effect.
-
(Custom) Define the date range:
- Select the Start date.
- Select the End date.
The custom date range must be within the last 18 months and no longer than 90 days.
-
(Optional) From the Analytics per media dropdown menu, select or type the name of a single media to analyze.
-
Click Run report. The dashboard data will update.
Updated 5 months ago