Get started with Dashboards
Gain a visual understanding of your content performance
Dashboard analytics deliver fast, visual access to the metrics that matter most. Use them to scan top-line trends or analyze the performance of individual media. Designed for decision-makers who need immediate clarity, these dashboards support executives, product owners, content strategists, and operations teams alike.
Analytics overview visualizations
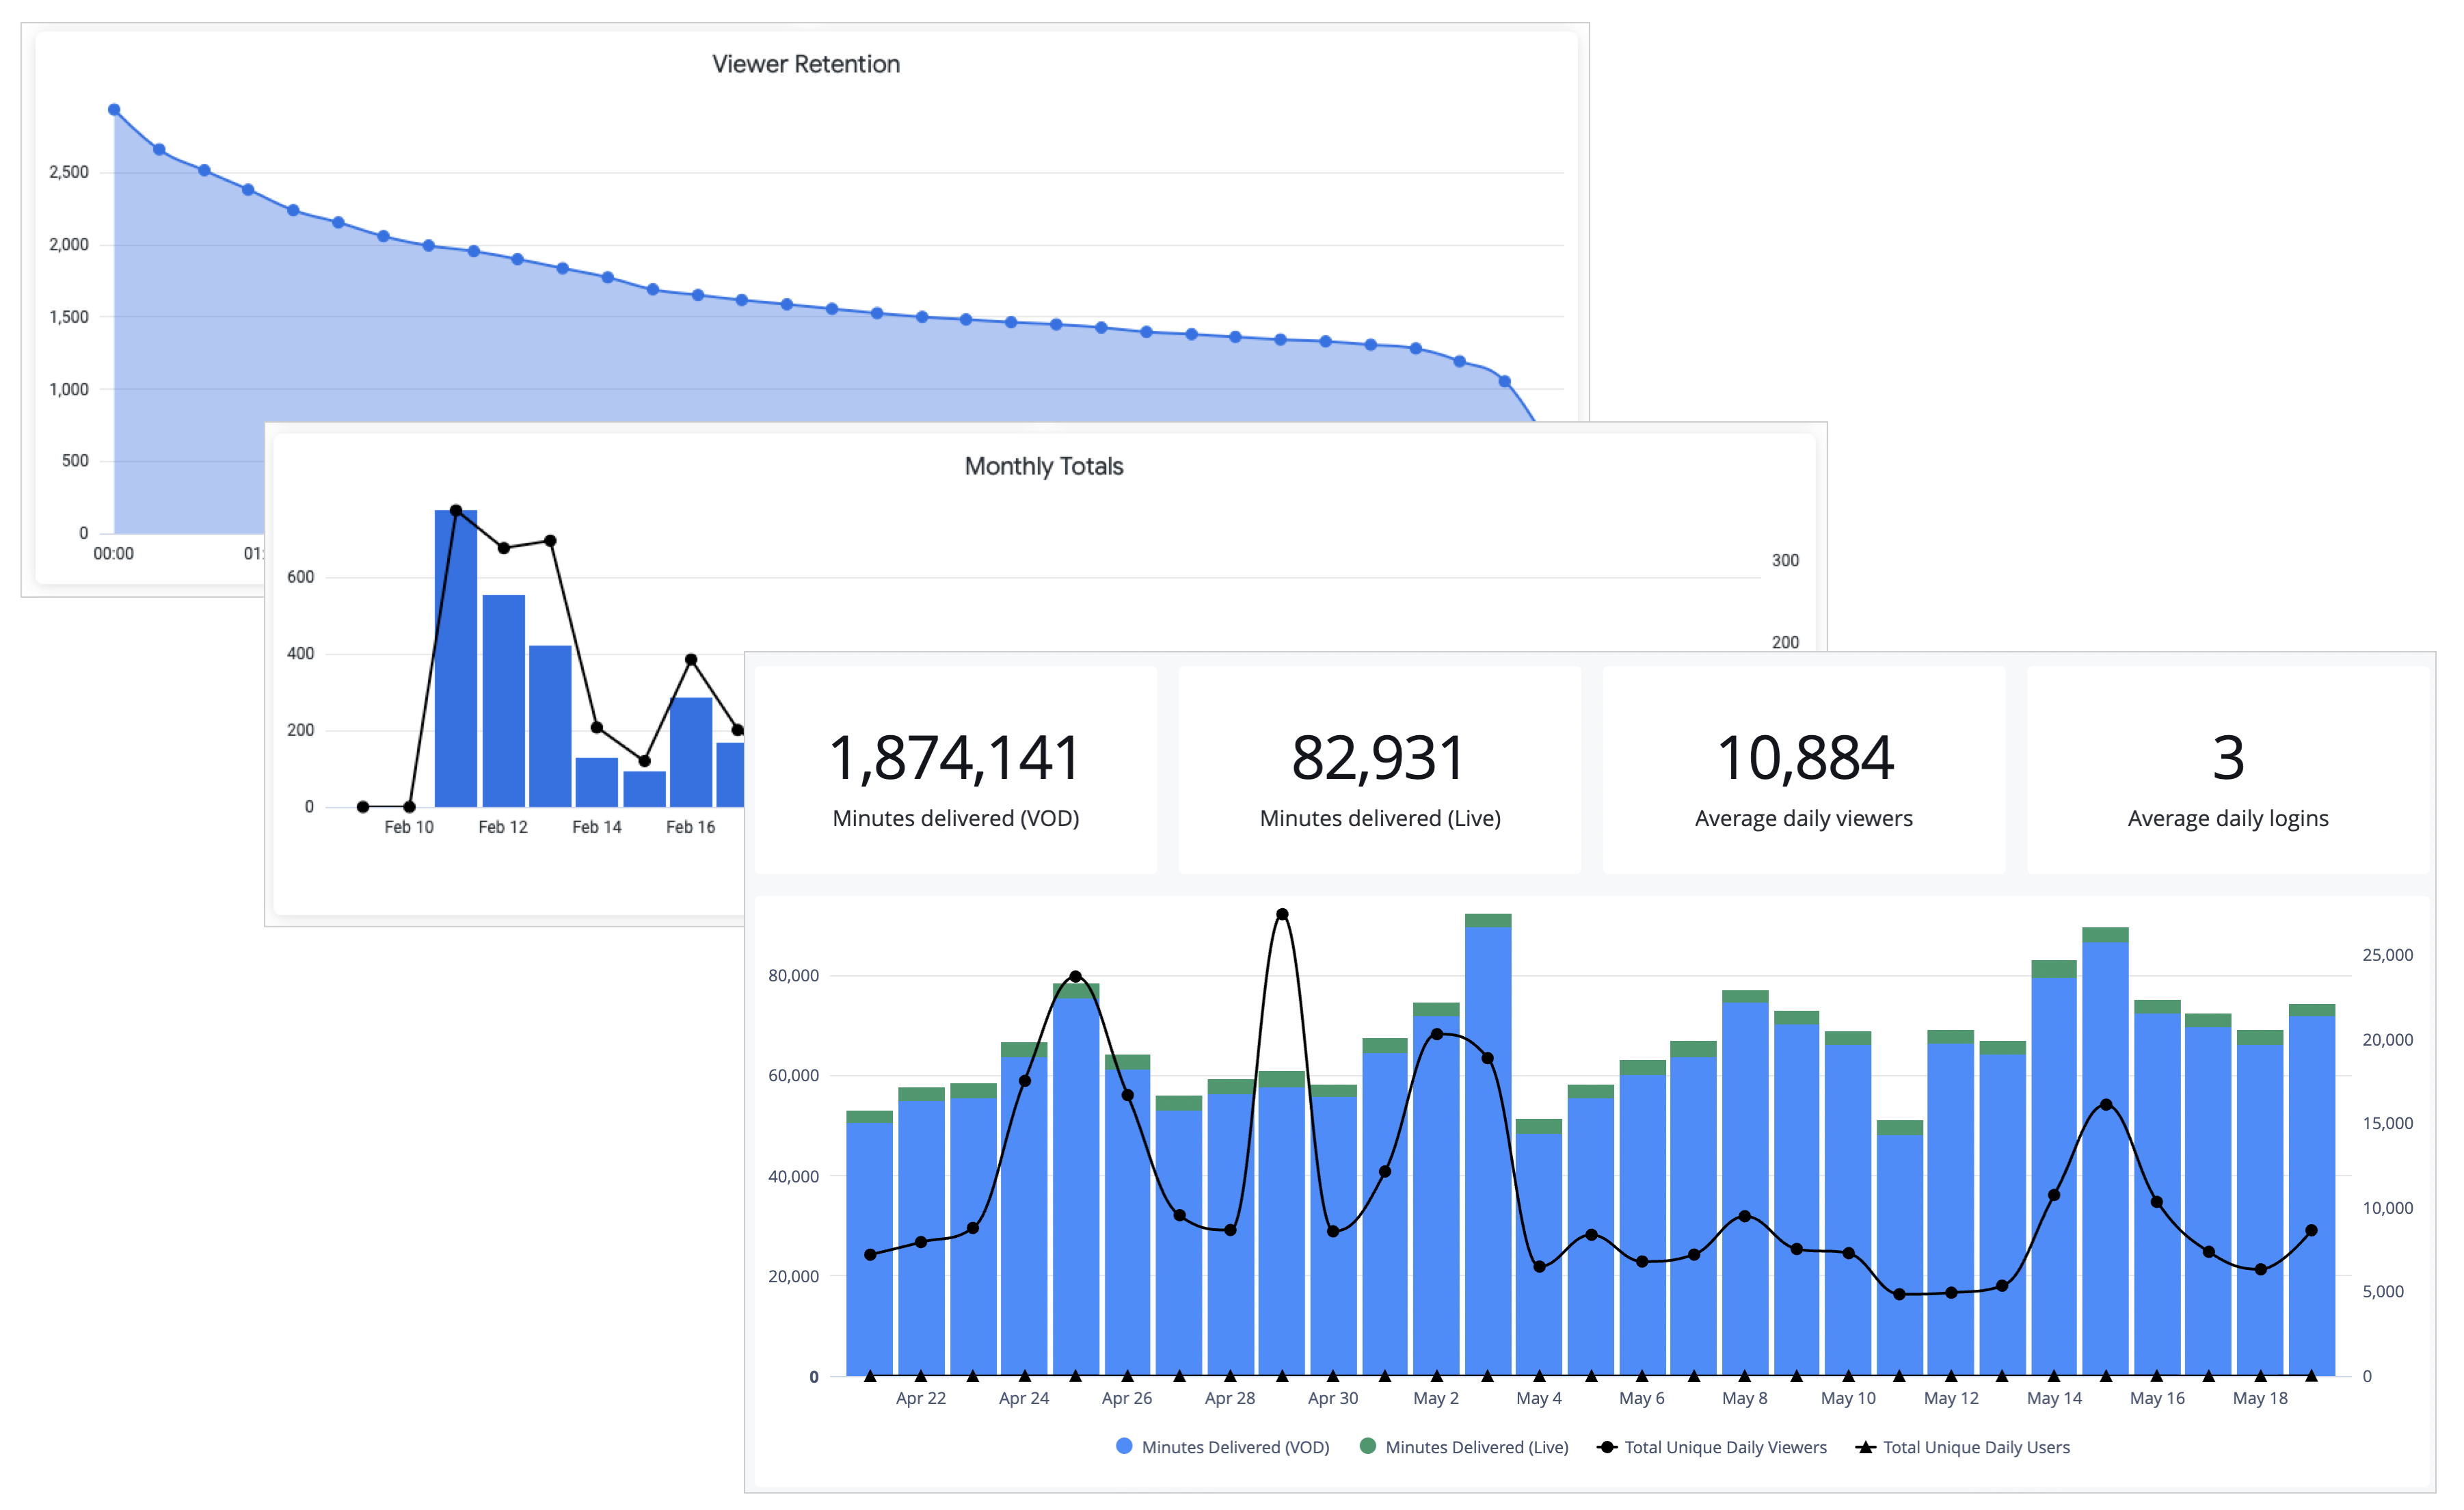
Each dashboard provides a high-level, configurable view of video performance across channels, geographies, and devices.
| Dashboard Analytics | Description |
|---|---|
| Playback | Overview of plays, ad impressions, engagement, geography, and library-wide performance trends |
| Streaming | Analysis of Live and VOD delivery, including daily usage patterns, top titles, and subscriber activity |
| Ad serving | Insights into where ad revenue is generated and what drives it, including ad delivery, demand performance, CPMs, and fill rates across countries, platforms, and domains |
| Real Time | Two-minute window of current plays and sessions for active monitoring |
Get started
To get started, select a dashboard tab to explore your content’s performance across time, regions, devices, and viewer behavior. Used together, these dashboards provide a multi-faceted view of your content strategy and impact.
Follow these steps to view analytics:
- On the Analytics overview page, click a tab.
- Learn about the data and refine it:
If you are interested in real-time data, learn more about Real Time analytics.
Updated 5 months ago