Ad Serving
Learn how to interpret ad serving performance data
High player starts don’t always translate into strong revenue, since ad delivery varies by geography, platform, demand source, and auction dynamics. Without visibility into these factors, you can’t diagnose why monetization is rising, plateauing, or underperforming.
In addition to total advertising revenue, the Ad serving tab shows where the revenue was earned and what drove it.
Ad Serving tab
Use the Ad serving tab to answer key questions such as the following:
- Which geographies, platforms, or domains are generating the most revenue?
- Are ad impressions and win rates keeping pace with audience growth?
- Which demand sources or line items deliver the strongest CPMs and fill rates?
- Where is monetization falling short: low win rate, low fill, or low-value traffic?
Prerequisite
| Item | Notes |
|---|---|
| Ad server entitlement | Entitlement to access ad serving analytics Contact your JWX representative for access to this data. |
Explore the Ad Serving tab
Each section of the Ad Serving tab highlights a specific part of the advertising performance. The following table explains each section and potential business usage.
| Section | Description | Business Use |
|---|---|---|
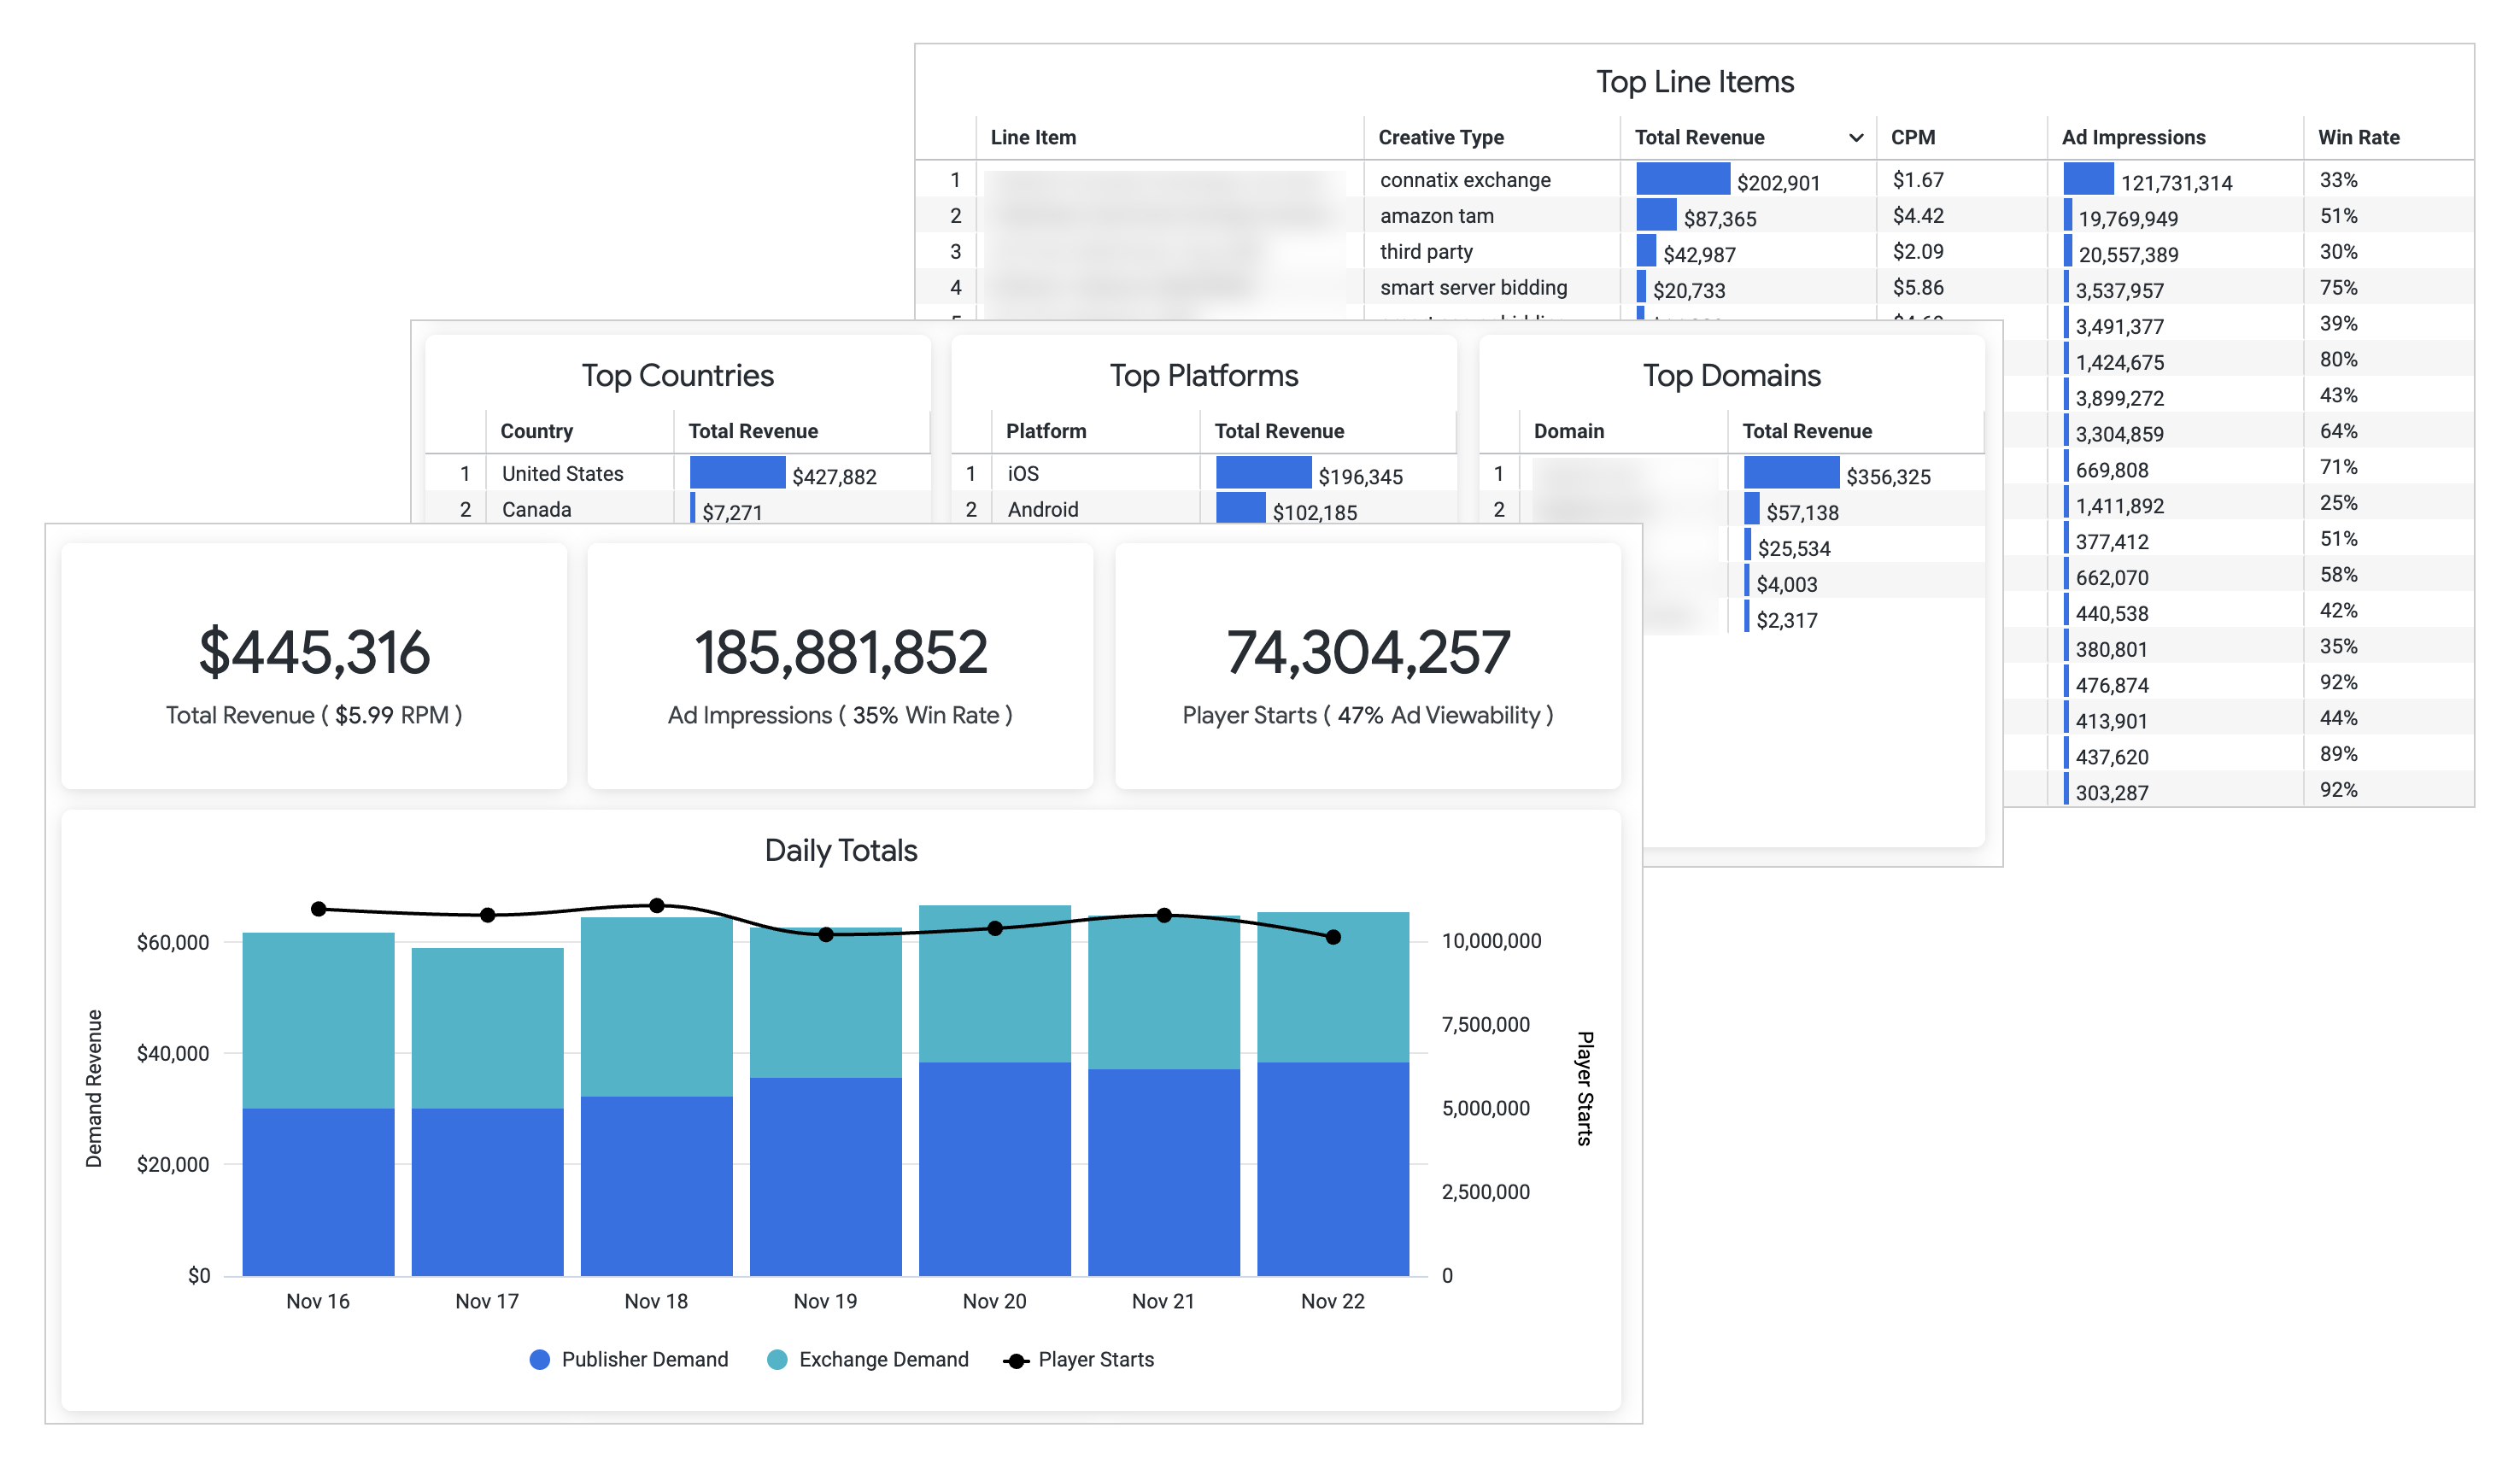
| Total Revenue | Amount of generated revenue | View advertising revenue during a specific timeframe. |
| Ad impressions | Number of ads that began playing across embedded video players | Track how many ads are actually delivered to viewers. |
| Player starts | Number of times media playback was initiated in the player | Track audience intent and engagement with the content. |
| Daily totals | Time-based chart comparing publisher and exchange demand revenue (bars) and player starts (line) | Identify shifts in demand revenue or content engagement. |
| Top countries | Countries ranked by total revenue | Identify where your most monetizable audiences are located. |
| Top platforms | Viewer platforms ranked by total revenue | Understand which devices drive the most revenue. |
| Top domains | Domains ranked by total revenue generated | Identify which partner sites or properties drive the most revenue, helping to inform monetization strategies. |
| Top line items | Line items generating revenue, ranked by total revenue, CPM, ad impressions, and win rate | Identify which campaigns drive the highest revenue, helping to inform monetization strategies. |
Refine the data
By default, the dashboard displays results from the Last 30 days across all line items. You can adjust the dataset by selecting an alternate predefined timeframe.
Follow these steps to update the displayed data:
- On the Analytics overview page, on the Ad Serving tab, select a predefined Timeframe.
- (Custom) Define the range:
- Select the Start date.
- Select the End date.
The custom date range must be within the last 18 months and no longer than 90 days.
- Click Run report. The dashboard data will update.
Updated 7 months ago