Create ad serving custom reports
Learn how to generate custom reports for ad serving
As a publisher, ad serving metrics help you understand how ads are delivered, viewed, and monetized across your inventory. These metrics provide insight into ad performance and revenue trends so you can identify issues, evaluate results, and make more informed monetization decisions.
Powered by Looker, playback custom reports allow you to analyze ad serving data:
- Generate reports using prebuilt templates or fully customized configurations
- Edit, save, and delete reports directly from your JWX dashboard
- Explore results through interactive visualizations, fields, and filters
Create a report
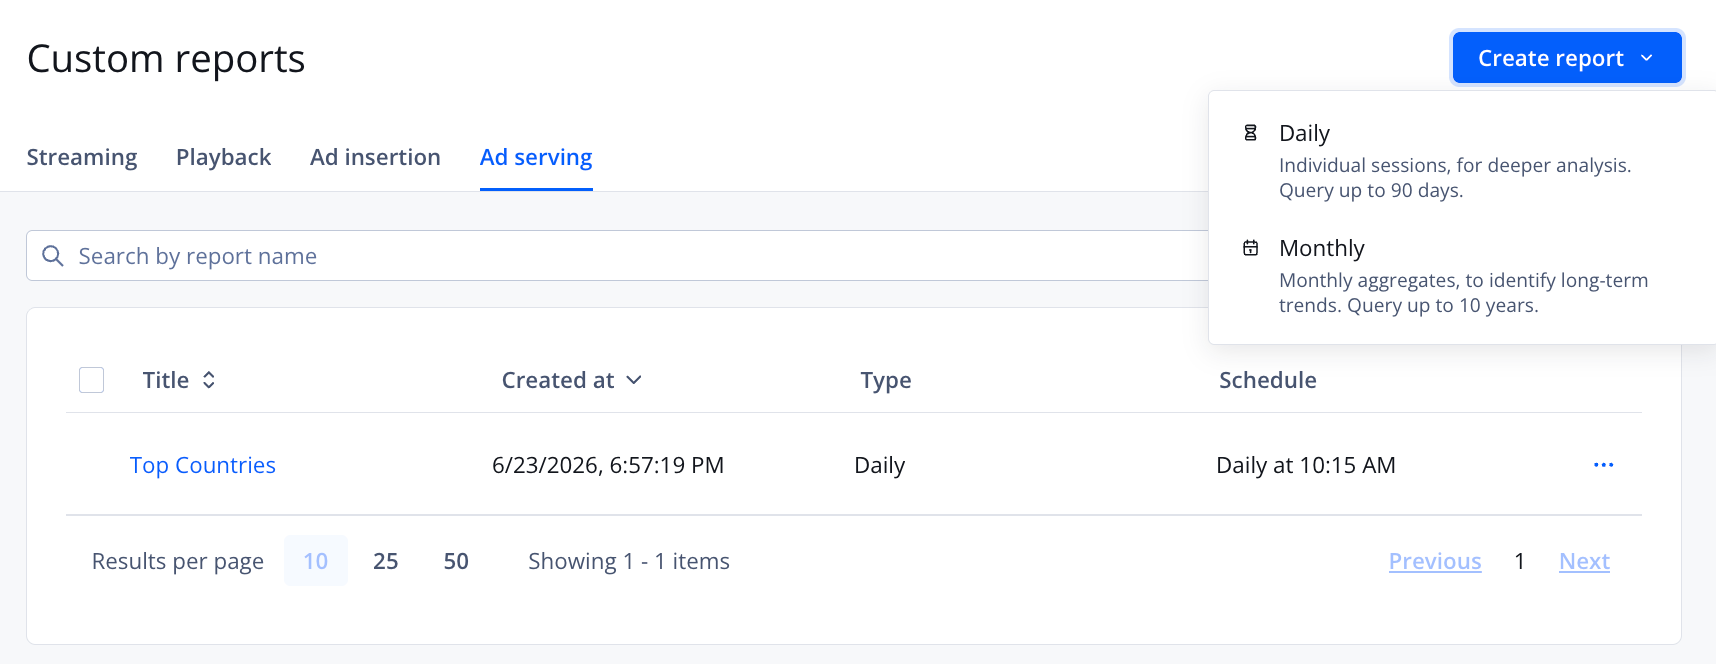
Ad serving custom reports tab
Follow these steps to generate a report:
- On the Custom reports page, on the Ad serving tab, click Create report and select a report type:
- Daily: Individual sessions. Enables deeper analysis. Query up to the last 90 days.
- Monthly: Monthly aggregates. Identify long-term trends.
- Enter a Report name.
- Set the dimensions and measures for the report:
Quick Start
Generate a report from prebuilt templates to quickly populate common analyses with minimal setup.
Under Quick Start, click one of the prebuilt analyses created from ad insertion analytics dimensions and measures to populate a report:- Top Countries
- Top Devices
- Top Domains
- Top Line Items
- Daily Totals | Monthly Totals
Custom reports
Build a fully-tailored report populated with dimensions and measures you choose.
In the left pane, on the All Fields tab, select one or more DIMENSIONS or MEASURES. The fields will appear in the main pane.
Follow these steps to learn about a specific dimension or measure:
- Hover over the dimension or metric.
- Click ⓘ (information icon). A pop-up window appears defining the value.
- (Optional) In the main pane, expand the Filters section to filter or limit data for the report.
- (Optional) Define a visualization or graph.
- Click Run to generate the report results.
- Click Save. The new report appears on the Ad serving tab.
Duplicate a report
Follow these steps to create a new report from an existing one:
- On the Custom reports page, on the Ad serving tab, click ⋯ > Duplicate in the row of a report.
- Enter a Report name
- In the left pane, on the All Fields tab, select one or more DIMENSIONS or MEASURES. The fields will appear in the main pane.
Follow these steps to learn about a specific dimension or metric:
- Hover over the dimension or metric.
- Click ⓘ (information icon). A pop-up window appears defining the value.
- (Optional) In the main pane, expand the Filters section to filter or limit data for the report.
- (Optional) Define a visualization or graph.
- Click Run to generate the report results.
- Click Save. The new report appears on the Ad serving tab.
Updated 20 days ago
Did this page help you?